

Question: Area- Table IV Standard Normal Distribution Z .00 .01 .02 .03 .004 -3.4 0.0003 0.0005 -2.9 .06 .08 0.0003 0.0003 0.0003 0.0003 0.0003 0.0003
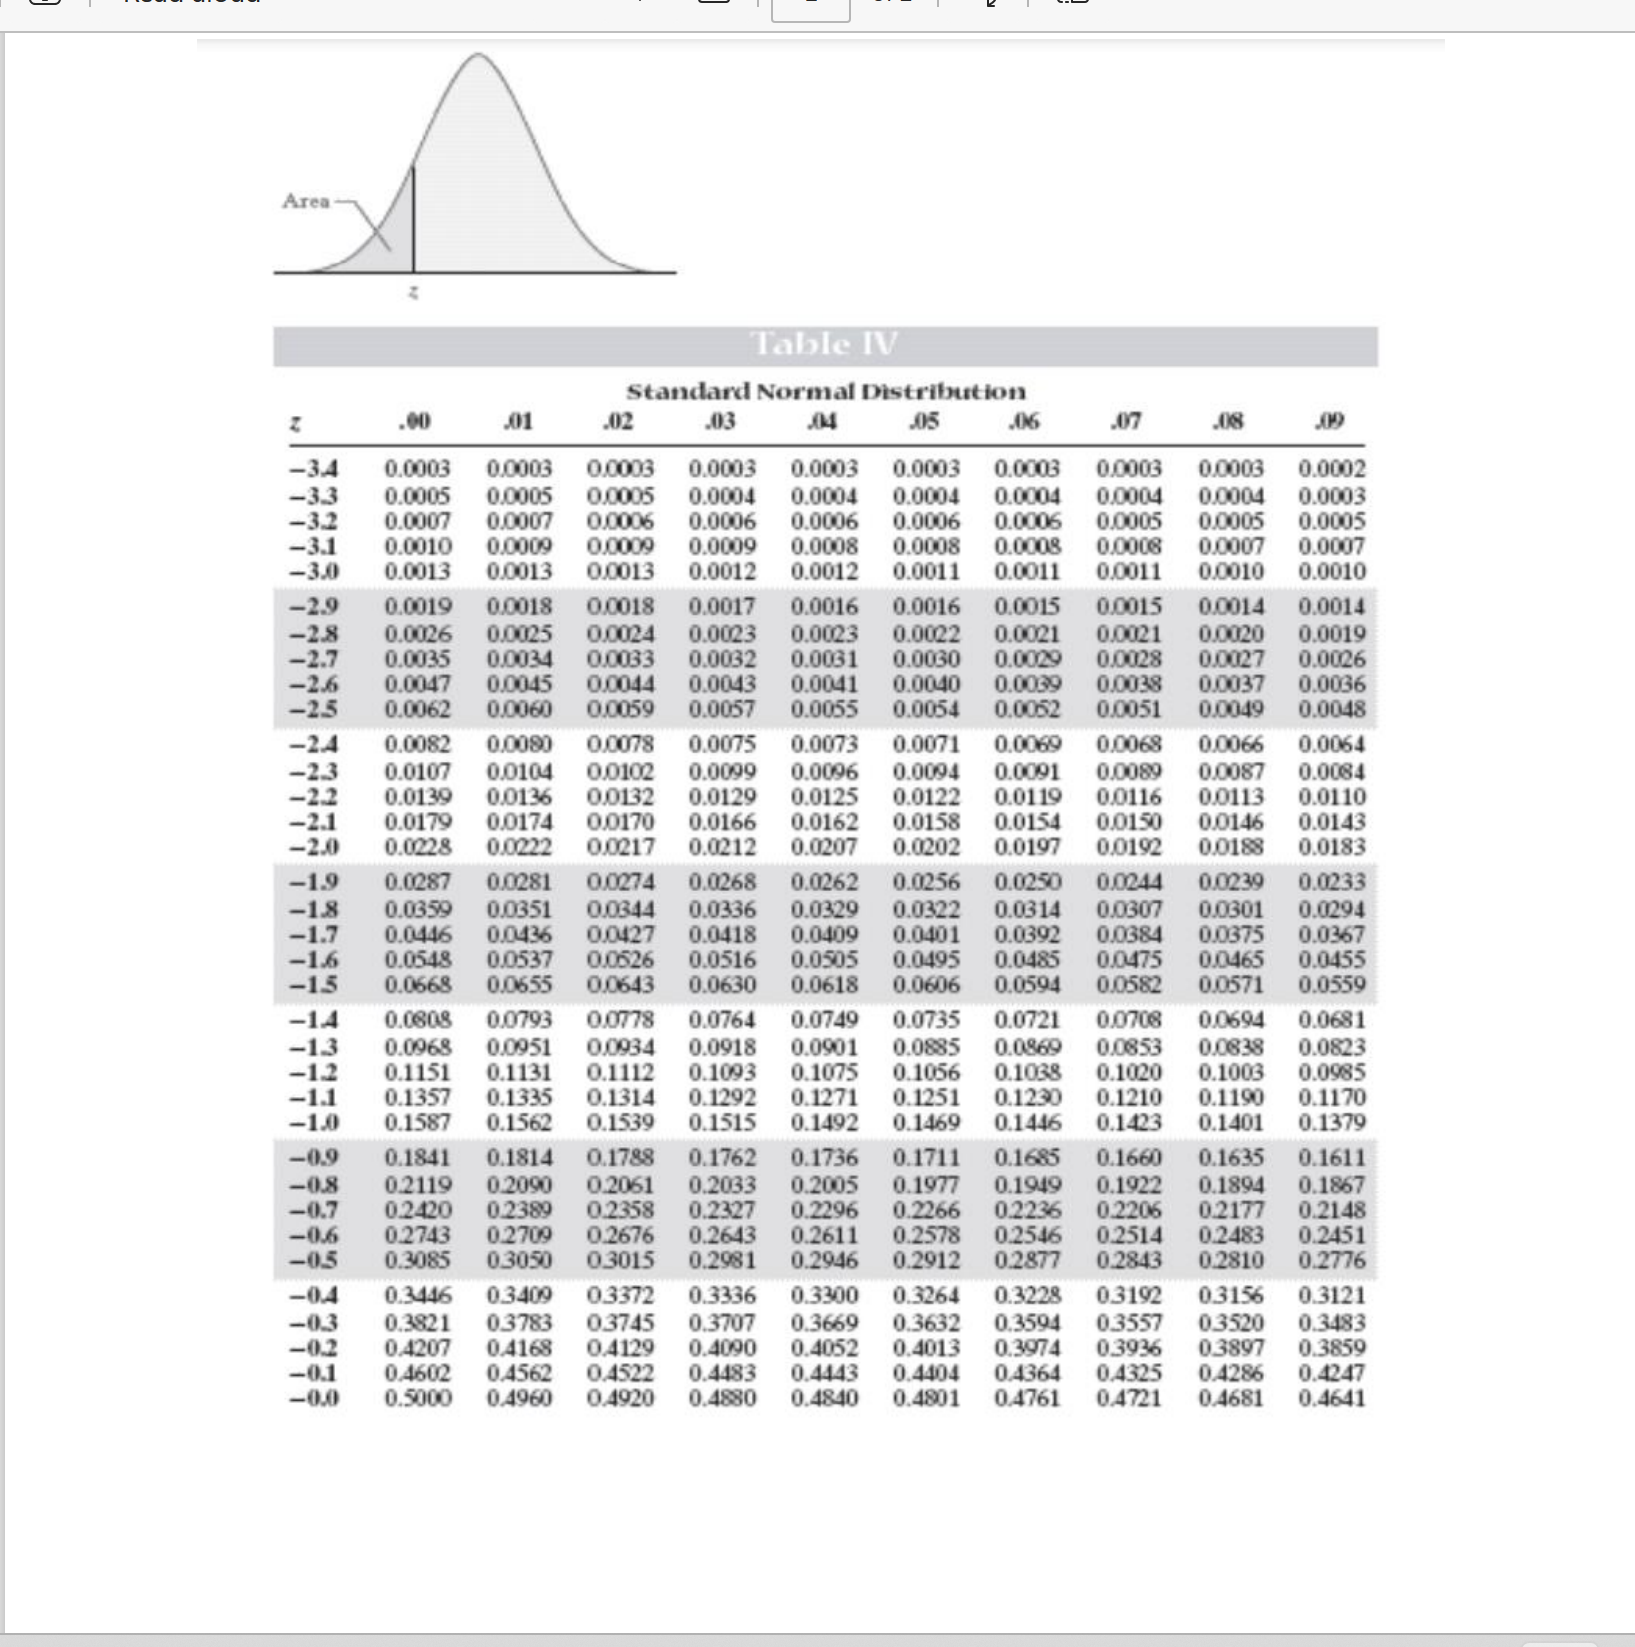
Area- Table IV Standard Normal Distribution Z .00 .01 .02 .03 .004 -3.4 0.0003 0.0005 -2.9 .06 .08 0.0003 0.0003 0.0003 0.0003 0.0003 0.0003 0.0003 0.0003 0.0002 -3.3 0.0005 0.0005 0.0004 0.0004 0.0004 0.0004 0.0004 0.0004 0.0003 -3.2 0.0007 0.0007 0.0006 0.0006 0.0006 0.0006 0.0006 0.0005 0.0005 0.0005 -3.1 0.0010 0.0009 0.0009 0.0009 0.0008 0.0008 0.0008 0.0008 0.0007 0.0007 -3.0 0.0013 0.0013 0.0013 0.0012 0.0012 0.0011 0.0011 0.0011 0.0010 0.0010 0.0019 0.0018 0.0018 0.0017 0.0016 0.0015 0.0014 0.0014 .05 .07 .09 0.0016 0.0015 -2.8 -2.7 -2.6 -2.5 0.0062 0.0060 0.0026 0.0025 0.0024 0.0035 0.0034 0.0033 0.0047 0.0045 0.0044 0.0043 0.0059 0.0057 0.0023 0.0023 0.0022 0.0021 0.0021 0.0020 0.0019 0.0032 0.0031 0.0030 0.0029 0.0028 0.0027 0.0026 0.0041 0.0040 0.0055 0.0039 0.0038 0.0037 0.0036 0.0054 0.0052 0.0051 0.0049 0.0048 -2.4 0.0082 0.0080 0.0078 0.0075 0.0073 0.0068 -2.3 -2.2 -2.0 0.0228 0.0222 0.0107 0.0104 0.0102 0.0139 0.0136 0.0132 0.0129 -2.1 0.0179 0.0174 0.0170 0.0166 0.0217 0.0099 0.0096 0.0125 0.0162 0.0158 0.0212 0.0207 0.0202 0.0154 0.0197 0.0071 0.0069 0.0094 0.0091 0.0089 0.0087 0.0084 0.0122 0.0119 0.0116 0.0113 0.0110 0.0150 0.0146 0.0143 0.0192 0.0066 0.0064 0.0188 0.0183 -1.9 0.0287 0.0281 0.0274 0.0268 0.0262 0.0336 -0.9 0.1736 -0.8 0.2005 0.0256 0.0250 -1.8 0.0359 0.0351 0.0344 0.0314 -1.7 0.0446 0.0436 0.0427 0.0418 0.0409 0.0401 0.0392 -1.6 0.0548 0.0537 0.0526 0.0516 0.0505 0.0495 0.0485 -15 0.0668 0.0655 0.0643 0.0630 0.0618 0.0606 -14 0.0808 0.0793 0.0778 0.0764 0.0749 0.0735 0.0721 0.0708 0.0694 0.0681 -13 0.0968 0.0951 0.0934 0.0918 0.0901 0.0885 0.0869 0.0853 0.0838 0.0823 -1.2 0.1151 0.1131 0.1112 0.1093 0.1075 0.1056 0.1038 0.1020 0.1003 0.0985 -1.1 0.1357 0.1335 0.1314 0.1292 0.1271 0.1251 0.1230 0.1210 0.1190 0.1170 -1.0 0.1587 0.1562 0.1539 0.1515 0.1492 0.1469 0.1446 0.1423 0.1841 0.1814 0.1788 0.1762 0.2119 0.2090 0.2061 0.2033 0.0244 0.0239 0.0233 0.0329 0.0322 0.0307 0.0301 0.0294 0.0384 0.0375 0.0367 0.0475 0.0465 0.0455 0.0594 0.0582 0.0571 0.0559 0.1401 0.1379 0.1711 0.1685 0.1660 0.1635 0.1611 0.1977 0.1949 0.1922 0.1894 0.1867 -0.7 0.2296 -0.6 0.2420 0.2389 0.2358 0.2327 0.2266 0.2236 0.2206 0.2177 0.2148 0.2743 0.2709 0.2676 0.2643 0.2611 0.2578 0.2546 0.2514 0.2483 0.2451 -0.5 0.3085 03050 03015 0.2981 0.2946 0.2912 0.2877 0.2843 0.2810 0.2776 -0.4 0.3446 0.3409 0.3372 0.3336 0.3300 0.3264 0.3228 0.3192 0.3156 0.3121 -0.3 0.3821 03783 0.3745 0.3707 0.3669 0.3632 0.3594 0.3557 0.3520 0.3483 -0.2 0.4207 0.4168 0.4129 0.4090 0.4052 0.4013 0.3974 0.3936 0.3897 0.3859 -0.1 0.4602 0.4562 0.4522 0.4483 0.4443 0.4404 0.4364 0.4325 0.4286 -0.0 0.5000 0.4960 0.4920 0.4880 0.4840 0.4801 0.4761 0.4721 0.4681 0.4247 0.4641 2.A researcher wishes to determine if exercise changes mental performance. Previously the mean population IQ was equal to 90 (on a scale of 0-100). 36 Individuals participate in a 30-minute exercise routine for the experiment. The exercise scores were normally distributed. The sample mean was 92. The population standard deviation was 2. Conduct the 2 tailed hypothesis test with a significance level = .05. a. Formulate the Null and Alternate Hypothesis b. Which test will you use in this scenario? Give your rationale why? C. Calculate the test statistics. Using the test statistics state whether you will reject or accept the null hypothesis. d. Find the p-value from the z score table. e. Use the p-value and the significance level a to decide and explain whether to reject or accept the Null Hypothesis. f. Create a graph to show the test statistics, critical statistics, alpha and p-value.
Step by Step Solution
There are 3 Steps involved in it

Get step-by-step solutions from verified subject matter experts