

Question: Armer Company is accumulating data to use in preparing its annual profit plan for the coming year. The cost behavior pattern of the maintenance costs
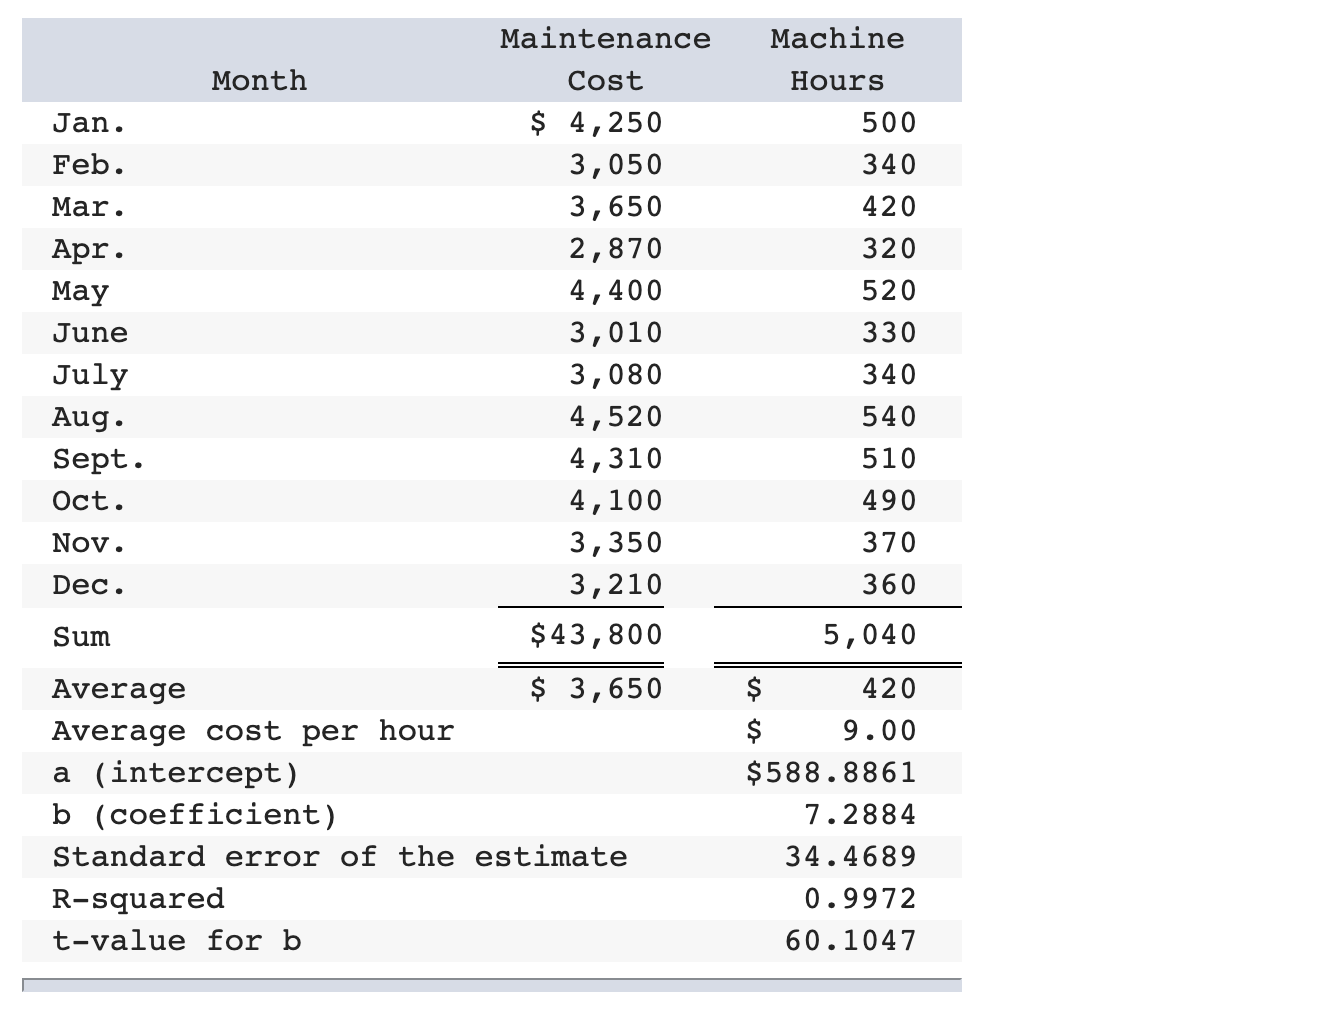

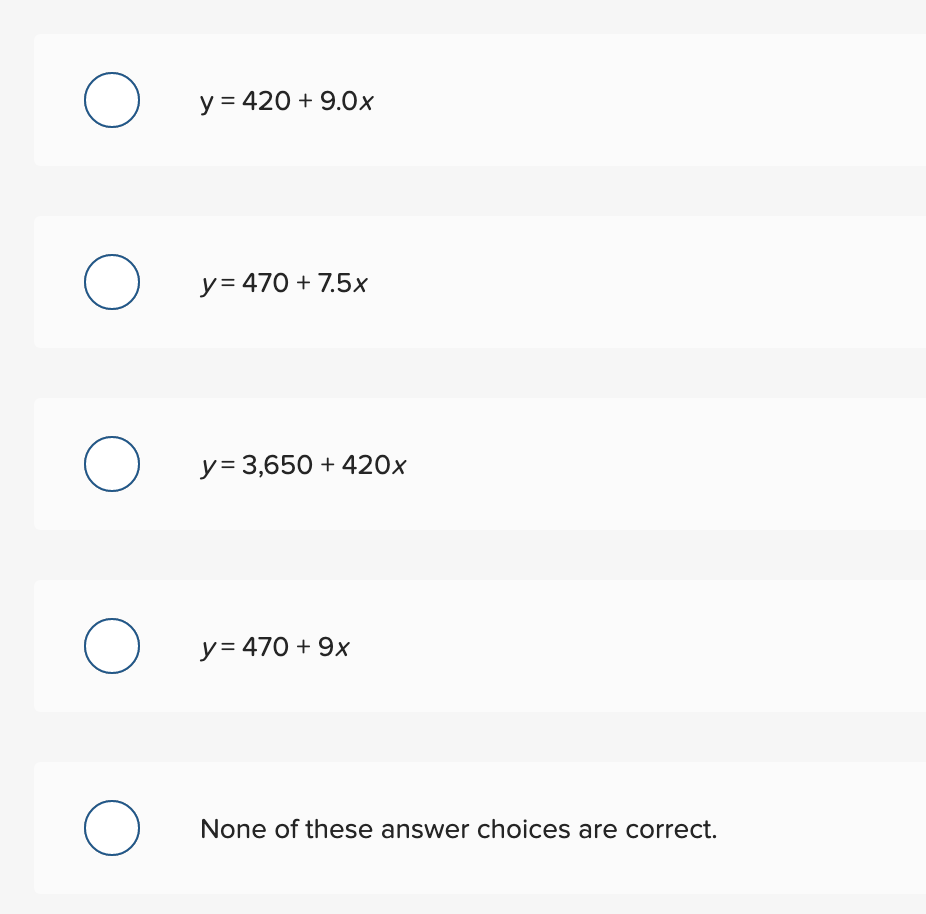
Armer Company is accumulating data to use in preparing its annual profit plan for the coming year. The cost behavior pattern of the maintenance costs must be determined. The accounting staff has suggested the use of linear regression to derive an equation for maintenance hours and costs. Data regarding the maintenance hours and costs for the last year and the results of the regression analysis follow: Maintenance Month Cost Jan. $ 4,250 Feb. 3,050 Mar. 3,650 Apr. 2,870 May 4,400 June 3,010 July 3,080 Aug. 4,520 Sept. 4,310 Oct. 4,100 Nov. 3,350 Dec. 3,210 Sum $ 43,800 Average $ 3,650 Average cost per hour a (intercept) b (coefficient) Standard error of the estimate R-squared t-value for b Machine Hours 500 340 420 320 520 330 340 540 510 490 370 360 5,040 $ 420 $ 9.00 $588.8861 7.2884 34.4689 0.9972 60.1047 If Armer Company uses the high-low method of analysis, the equation for the relationship between hours of activity and maintenance cost follows: (Do not round intermediate calculations.) y = 420 + 9.0x (0) y= 470 + 7.5x y= 3,650 + 420x O y= 470 + 9x None of these answer choices are correct
Step by Step Solution
There are 3 Steps involved in it

Get step-by-step solutions from verified subject matter experts