

Analyze the financial strength and trends of the two ompanies. Complete the provided template A...
Fantastic news! We've Found the answer you've been seeking!
Question:
Transcribed Image Text:
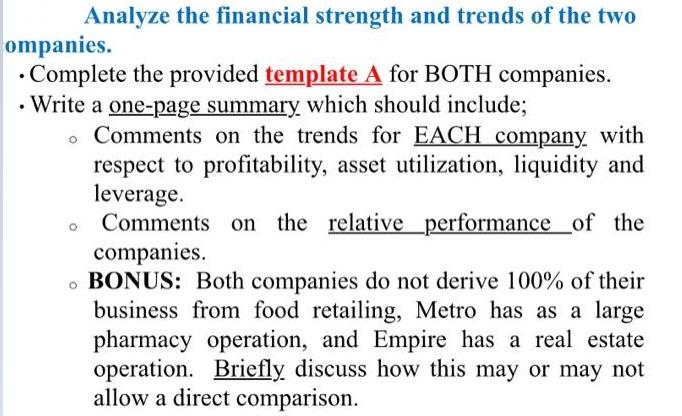
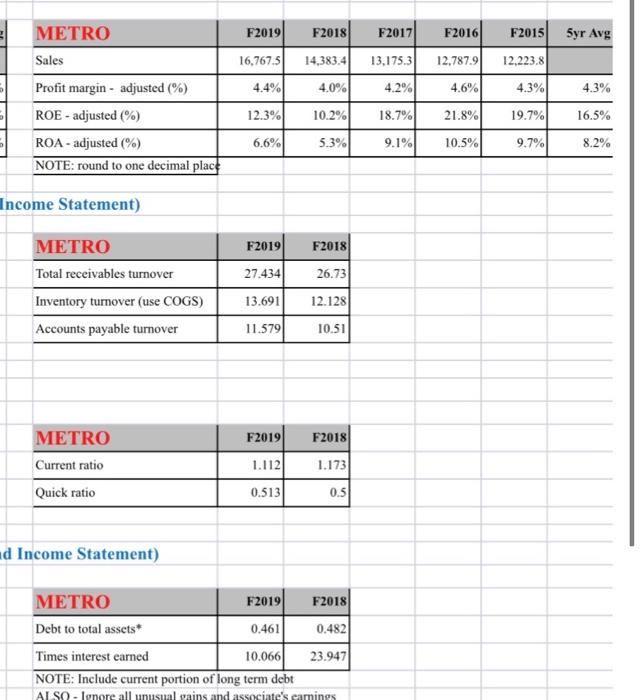
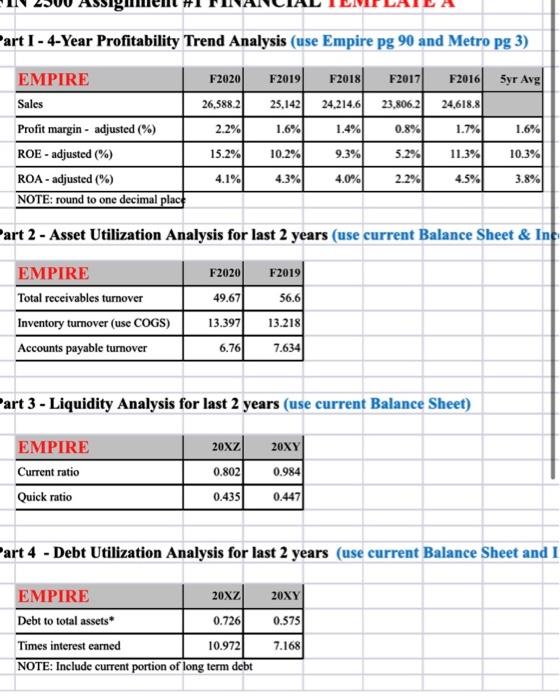
Analyze the financial strength and trends of the two ompanies. • Complete the provided template A for BOTH companies. • Write a one-page summary which should include; o Comments on the trends for EACH company with respect to profitability, asset utilization, liquidity and leverage. Comments on the relative _performance of the companies. o BONUS: Both companies do not derive 100% of their business from food retailing, Metro has as a large pharmacy operation, and Empire has a real estate operation. Briefly discuss how this may or may not allow a direct comparison. МЕTRO F2019 F2018 F2017 F2016 F2015 Syr Avg Sales 16,767.5 14,383.4 13,175.3 12,787.9 12,223.8 Profit margin - adjusted (%) 4.4% 4.0% 4.2% 4.6% 4.3% 4.3% ROE - adjusted (%) 12.3% 10.2% 18.7% 21.8% 19.7% 16.5% ROA - adjusted (%) 6.6% 5.3% 9.1% 10.5% 9.7% 8.2% NOTE: round to one decimal place Income Statement) METRO F2019 F2018 Total receivables turnover 27.434 26.73 Inventory turnover (use COGS) 13.691 12.128 Accounts payable turnover 11.579 10.51 МЕTRO F2019 F2018 Current ratio L.112 1.173 Quick ratio 0.513 0.5 d Income Statement) МЕTRO F2019 F2018 Debt to total assets* 0.461 0.482 Times interest earned 10.066 23.947 NOTE: Include current portion of long term debt ALSO - lønore all unusual gains and associate's earnings Part I- 4-Year Profitability Trend Analysis (use Empire pg 90 and Metro pg 3) EMPIRE F2020 F2019 F2018 F2017 F2016 Syr Avg 26,588.2 25,142 24,214.6 23,806.2 24,618.8 Sales Profit margin - adjusted (%) 2.2% 1.6% 1.4% 0.8% 1.7% 1.6% ROE - adjusted (%) 15.2% 10.2% 9.3% 5.2% 11.3% 10.3% ROA - adjusted (%) 4.1% 4.3% 4.0% 2.2% 4.5% 3.8% NOTE: round to one decimal place Part 2- Asset Utilization Analysis for last 2 years (use current Balance Sheet & Inc EMPIRE F2020 F2019 Total receivables turnover 49.67 56.6 Inventory turnover (use COGS) 13.397 13.218 Accounts payable turnover 6.76 7.634 Part 3- Liquidity Analysis for last 2 years (use current Balance Sheet) EMPIRE 20XZ 20XY Current ratio 0.802 0.984 Quick ratio 0.435 0.447 Part 4 Debt Utilization Analysis for last 2 years (use current Balance Sheet and I EMPIRE 20XZ 20XY Debt to total assets* 0.726 0.575 Times interest earned 10.972 7.168 NOTE: Include current portion of long term debt Analyze the financial strength and trends of the two ompanies. • Complete the provided template A for BOTH companies. • Write a one-page summary which should include; o Comments on the trends for EACH company with respect to profitability, asset utilization, liquidity and leverage. Comments on the relative _performance of the companies. o BONUS: Both companies do not derive 100% of their business from food retailing, Metro has as a large pharmacy operation, and Empire has a real estate operation. Briefly discuss how this may or may not allow a direct comparison. МЕTRO F2019 F2018 F2017 F2016 F2015 Syr Avg Sales 16,767.5 14,383.4 13,175.3 12,787.9 12,223.8 Profit margin - adjusted (%) 4.4% 4.0% 4.2% 4.6% 4.3% 4.3% ROE - adjusted (%) 12.3% 10.2% 18.7% 21.8% 19.7% 16.5% ROA - adjusted (%) 6.6% 5.3% 9.1% 10.5% 9.7% 8.2% NOTE: round to one decimal place Income Statement) METRO F2019 F2018 Total receivables turnover 27.434 26.73 Inventory turnover (use COGS) 13.691 12.128 Accounts payable turnover 11.579 10.51 МЕTRO F2019 F2018 Current ratio L.112 1.173 Quick ratio 0.513 0.5 d Income Statement) МЕTRO F2019 F2018 Debt to total assets* 0.461 0.482 Times interest earned 10.066 23.947 NOTE: Include current portion of long term debt ALSO - lønore all unusual gains and associate's earnings Part I- 4-Year Profitability Trend Analysis (use Empire pg 90 and Metro pg 3) EMPIRE F2020 F2019 F2018 F2017 F2016 Syr Avg 26,588.2 25,142 24,214.6 23,806.2 24,618.8 Sales Profit margin - adjusted (%) 2.2% 1.6% 1.4% 0.8% 1.7% 1.6% ROE - adjusted (%) 15.2% 10.2% 9.3% 5.2% 11.3% 10.3% ROA - adjusted (%) 4.1% 4.3% 4.0% 2.2% 4.5% 3.8% NOTE: round to one decimal place Part 2- Asset Utilization Analysis for last 2 years (use current Balance Sheet & Inc EMPIRE F2020 F2019 Total receivables turnover 49.67 56.6 Inventory turnover (use COGS) 13.397 13.218 Accounts payable turnover 6.76 7.634 Part 3- Liquidity Analysis for last 2 years (use current Balance Sheet) EMPIRE 20XZ 20XY Current ratio 0.802 0.984 Quick ratio 0.435 0.447 Part 4 Debt Utilization Analysis for last 2 years (use current Balance Sheet and I EMPIRE 20XZ 20XY Debt to total assets* 0.726 0.575 Times interest earned 10.972 7.168 NOTE: Include current portion of long term debt Analyze the financial strength and trends of the two ompanies. • Complete the provided template A for BOTH companies. • Write a one-page summary which should include; o Comments on the trends for EACH company with respect to profitability, asset utilization, liquidity and leverage. Comments on the relative _performance of the companies. o BONUS: Both companies do not derive 100% of their business from food retailing, Metro has as a large pharmacy operation, and Empire has a real estate operation. Briefly discuss how this may or may not allow a direct comparison. МЕTRO F2019 F2018 F2017 F2016 F2015 Syr Avg Sales 16,767.5 14,383.4 13,175.3 12,787.9 12,223.8 Profit margin - adjusted (%) 4.4% 4.0% 4.2% 4.6% 4.3% 4.3% ROE - adjusted (%) 12.3% 10.2% 18.7% 21.8% 19.7% 16.5% ROA - adjusted (%) 6.6% 5.3% 9.1% 10.5% 9.7% 8.2% NOTE: round to one decimal place Income Statement) METRO F2019 F2018 Total receivables turnover 27.434 26.73 Inventory turnover (use COGS) 13.691 12.128 Accounts payable turnover 11.579 10.51 МЕTRO F2019 F2018 Current ratio L.112 1.173 Quick ratio 0.513 0.5 d Income Statement) МЕTRO F2019 F2018 Debt to total assets* 0.461 0.482 Times interest earned 10.066 23.947 NOTE: Include current portion of long term debt ALSO - lønore all unusual gains and associate's earnings Part I- 4-Year Profitability Trend Analysis (use Empire pg 90 and Metro pg 3) EMPIRE F2020 F2019 F2018 F2017 F2016 Syr Avg 26,588.2 25,142 24,214.6 23,806.2 24,618.8 Sales Profit margin - adjusted (%) 2.2% 1.6% 1.4% 0.8% 1.7% 1.6% ROE - adjusted (%) 15.2% 10.2% 9.3% 5.2% 11.3% 10.3% ROA - adjusted (%) 4.1% 4.3% 4.0% 2.2% 4.5% 3.8% NOTE: round to one decimal place Part 2- Asset Utilization Analysis for last 2 years (use current Balance Sheet & Inc EMPIRE F2020 F2019 Total receivables turnover 49.67 56.6 Inventory turnover (use COGS) 13.397 13.218 Accounts payable turnover 6.76 7.634 Part 3- Liquidity Analysis for last 2 years (use current Balance Sheet) EMPIRE 20XZ 20XY Current ratio 0.802 0.984 Quick ratio 0.435 0.447 Part 4 Debt Utilization Analysis for last 2 years (use current Balance Sheet and I EMPIRE 20XZ 20XY Debt to total assets* 0.726 0.575 Times interest earned 10.972 7.168 NOTE: Include current portion of long term debt Analyze the financial strength and trends of the two ompanies. • Complete the provided template A for BOTH companies. • Write a one-page summary which should include; o Comments on the trends for EACH company with respect to profitability, asset utilization, liquidity and leverage. Comments on the relative _performance of the companies. o BONUS: Both companies do not derive 100% of their business from food retailing, Metro has as a large pharmacy operation, and Empire has a real estate operation. Briefly discuss how this may or may not allow a direct comparison. МЕTRO F2019 F2018 F2017 F2016 F2015 Syr Avg Sales 16,767.5 14,383.4 13,175.3 12,787.9 12,223.8 Profit margin - adjusted (%) 4.4% 4.0% 4.2% 4.6% 4.3% 4.3% ROE - adjusted (%) 12.3% 10.2% 18.7% 21.8% 19.7% 16.5% ROA - adjusted (%) 6.6% 5.3% 9.1% 10.5% 9.7% 8.2% NOTE: round to one decimal place Income Statement) METRO F2019 F2018 Total receivables turnover 27.434 26.73 Inventory turnover (use COGS) 13.691 12.128 Accounts payable turnover 11.579 10.51 МЕTRO F2019 F2018 Current ratio L.112 1.173 Quick ratio 0.513 0.5 d Income Statement) МЕTRO F2019 F2018 Debt to total assets* 0.461 0.482 Times interest earned 10.066 23.947 NOTE: Include current portion of long term debt ALSO - lønore all unusual gains and associate's earnings Part I- 4-Year Profitability Trend Analysis (use Empire pg 90 and Metro pg 3) EMPIRE F2020 F2019 F2018 F2017 F2016 Syr Avg 26,588.2 25,142 24,214.6 23,806.2 24,618.8 Sales Profit margin - adjusted (%) 2.2% 1.6% 1.4% 0.8% 1.7% 1.6% ROE - adjusted (%) 15.2% 10.2% 9.3% 5.2% 11.3% 10.3% ROA - adjusted (%) 4.1% 4.3% 4.0% 2.2% 4.5% 3.8% NOTE: round to one decimal place Part 2- Asset Utilization Analysis for last 2 years (use current Balance Sheet & Inc EMPIRE F2020 F2019 Total receivables turnover 49.67 56.6 Inventory turnover (use COGS) 13.397 13.218 Accounts payable turnover 6.76 7.634 Part 3- Liquidity Analysis for last 2 years (use current Balance Sheet) EMPIRE 20XZ 20XY Current ratio 0.802 0.984 Quick ratio 0.435 0.447 Part 4 Debt Utilization Analysis for last 2 years (use current Balance Sheet and I EMPIRE 20XZ 20XY Debt to total assets* 0.726 0.575 Times interest earned 10.972 7.168 NOTE: Include current portion of long term debt Analyze the financial strength and trends of the two ompanies. • Complete the provided template A for BOTH companies. • Write a one-page summary which should include; o Comments on the trends for EACH company with respect to profitability, asset utilization, liquidity and leverage. Comments on the relative _performance of the companies. o BONUS: Both companies do not derive 100% of their business from food retailing, Metro has as a large pharmacy operation, and Empire has a real estate operation. Briefly discuss how this may or may not allow a direct comparison. МЕTRO F2019 F2018 F2017 F2016 F2015 Syr Avg Sales 16,767.5 14,383.4 13,175.3 12,787.9 12,223.8 Profit margin - adjusted (%) 4.4% 4.0% 4.2% 4.6% 4.3% 4.3% ROE - adjusted (%) 12.3% 10.2% 18.7% 21.8% 19.7% 16.5% ROA - adjusted (%) 6.6% 5.3% 9.1% 10.5% 9.7% 8.2% NOTE: round to one decimal place Income Statement) METRO F2019 F2018 Total receivables turnover 27.434 26.73 Inventory turnover (use COGS) 13.691 12.128 Accounts payable turnover 11.579 10.51 МЕTRO F2019 F2018 Current ratio L.112 1.173 Quick ratio 0.513 0.5 d Income Statement) МЕTRO F2019 F2018 Debt to total assets* 0.461 0.482 Times interest earned 10.066 23.947 NOTE: Include current portion of long term debt ALSO - lønore all unusual gains and associate's earnings Part I- 4-Year Profitability Trend Analysis (use Empire pg 90 and Metro pg 3) EMPIRE F2020 F2019 F2018 F2017 F2016 Syr Avg 26,588.2 25,142 24,214.6 23,806.2 24,618.8 Sales Profit margin - adjusted (%) 2.2% 1.6% 1.4% 0.8% 1.7% 1.6% ROE - adjusted (%) 15.2% 10.2% 9.3% 5.2% 11.3% 10.3% ROA - adjusted (%) 4.1% 4.3% 4.0% 2.2% 4.5% 3.8% NOTE: round to one decimal place Part 2- Asset Utilization Analysis for last 2 years (use current Balance Sheet & Inc EMPIRE F2020 F2019 Total receivables turnover 49.67 56.6 Inventory turnover (use COGS) 13.397 13.218 Accounts payable turnover 6.76 7.634 Part 3- Liquidity Analysis for last 2 years (use current Balance Sheet) EMPIRE 20XZ 20XY Current ratio 0.802 0.984 Quick ratio 0.435 0.447 Part 4 Debt Utilization Analysis for last 2 years (use current Balance Sheet and I EMPIRE 20XZ 20XY Debt to total assets* 0.726 0.575 Times interest earned 10.972 7.168 NOTE: Include current portion of long term debt Analyze the financial strength and trends of the two ompanies. • Complete the provided template A for BOTH companies. • Write a one-page summary which should include; o Comments on the trends for EACH company with respect to profitability, asset utilization, liquidity and leverage. Comments on the relative _performance of the companies. o BONUS: Both companies do not derive 100% of their business from food retailing, Metro has as a large pharmacy operation, and Empire has a real estate operation. Briefly discuss how this may or may not allow a direct comparison. МЕTRO F2019 F2018 F2017 F2016 F2015 Syr Avg Sales 16,767.5 14,383.4 13,175.3 12,787.9 12,223.8 Profit margin - adjusted (%) 4.4% 4.0% 4.2% 4.6% 4.3% 4.3% ROE - adjusted (%) 12.3% 10.2% 18.7% 21.8% 19.7% 16.5% ROA - adjusted (%) 6.6% 5.3% 9.1% 10.5% 9.7% 8.2% NOTE: round to one decimal place Income Statement) METRO F2019 F2018 Total receivables turnover 27.434 26.73 Inventory turnover (use COGS) 13.691 12.128 Accounts payable turnover 11.579 10.51 МЕTRO F2019 F2018 Current ratio L.112 1.173 Quick ratio 0.513 0.5 d Income Statement) МЕTRO F2019 F2018 Debt to total assets* 0.461 0.482 Times interest earned 10.066 23.947 NOTE: Include current portion of long term debt ALSO - lønore all unusual gains and associate's earnings Part I- 4-Year Profitability Trend Analysis (use Empire pg 90 and Metro pg 3) EMPIRE F2020 F2019 F2018 F2017 F2016 Syr Avg 26,588.2 25,142 24,214.6 23,806.2 24,618.8 Sales Profit margin - adjusted (%) 2.2% 1.6% 1.4% 0.8% 1.7% 1.6% ROE - adjusted (%) 15.2% 10.2% 9.3% 5.2% 11.3% 10.3% ROA - adjusted (%) 4.1% 4.3% 4.0% 2.2% 4.5% 3.8% NOTE: round to one decimal place Part 2- Asset Utilization Analysis for last 2 years (use current Balance Sheet & Inc EMPIRE F2020 F2019 Total receivables turnover 49.67 56.6 Inventory turnover (use COGS) 13.397 13.218 Accounts payable turnover 6.76 7.634 Part 3- Liquidity Analysis for last 2 years (use current Balance Sheet) EMPIRE 20XZ 20XY Current ratio 0.802 0.984 Quick ratio 0.435 0.447 Part 4 Debt Utilization Analysis for last 2 years (use current Balance Sheet and I EMPIRE 20XZ 20XY Debt to total assets* 0.726 0.575 Times interest earned 10.972 7.168 NOTE: Include current portion of long term debt Analyze the financial strength and trends of the two ompanies. • Complete the provided template A for BOTH companies. • Write a one-page summary which should include; o Comments on the trends for EACH company with respect to profitability, asset utilization, liquidity and leverage. Comments on the relative _performance of the companies. o BONUS: Both companies do not derive 100% of their business from food retailing, Metro has as a large pharmacy operation, and Empire has a real estate operation. Briefly discuss how this may or may not allow a direct comparison. МЕTRO F2019 F2018 F2017 F2016 F2015 Syr Avg Sales 16,767.5 14,383.4 13,175.3 12,787.9 12,223.8 Profit margin - adjusted (%) 4.4% 4.0% 4.2% 4.6% 4.3% 4.3% ROE - adjusted (%) 12.3% 10.2% 18.7% 21.8% 19.7% 16.5% ROA - adjusted (%) 6.6% 5.3% 9.1% 10.5% 9.7% 8.2% NOTE: round to one decimal place Income Statement) METRO F2019 F2018 Total receivables turnover 27.434 26.73 Inventory turnover (use COGS) 13.691 12.128 Accounts payable turnover 11.579 10.51 МЕTRO F2019 F2018 Current ratio L.112 1.173 Quick ratio 0.513 0.5 d Income Statement) МЕTRO F2019 F2018 Debt to total assets* 0.461 0.482 Times interest earned 10.066 23.947 NOTE: Include current portion of long term debt ALSO - lønore all unusual gains and associate's earnings Part I- 4-Year Profitability Trend Analysis (use Empire pg 90 and Metro pg 3) EMPIRE F2020 F2019 F2018 F2017 F2016 Syr Avg 26,588.2 25,142 24,214.6 23,806.2 24,618.8 Sales Profit margin - adjusted (%) 2.2% 1.6% 1.4% 0.8% 1.7% 1.6% ROE - adjusted (%) 15.2% 10.2% 9.3% 5.2% 11.3% 10.3% ROA - adjusted (%) 4.1% 4.3% 4.0% 2.2% 4.5% 3.8% NOTE: round to one decimal place Part 2- Asset Utilization Analysis for last 2 years (use current Balance Sheet & Inc EMPIRE F2020 F2019 Total receivables turnover 49.67 56.6 Inventory turnover (use COGS) 13.397 13.218 Accounts payable turnover 6.76 7.634 Part 3- Liquidity Analysis for last 2 years (use current Balance Sheet) EMPIRE 20XZ 20XY Current ratio 0.802 0.984 Quick ratio 0.435 0.447 Part 4 Debt Utilization Analysis for last 2 years (use current Balance Sheet and I EMPIRE 20XZ 20XY Debt to total assets* 0.726 0.575 Times interest earned 10.972 7.168 NOTE: Include current portion of long term debt Analyze the financial strength and trends of the two ompanies. • Complete the provided template A for BOTH companies. • Write a one-page summary which should include; o Comments on the trends for EACH company with respect to profitability, asset utilization, liquidity and leverage. Comments on the relative _performance of the companies. o BONUS: Both companies do not derive 100% of their business from food retailing, Metro has as a large pharmacy operation, and Empire has a real estate operation. Briefly discuss how this may or may not allow a direct comparison. МЕTRO F2019 F2018 F2017 F2016 F2015 Syr Avg Sales 16,767.5 14,383.4 13,175.3 12,787.9 12,223.8 Profit margin - adjusted (%) 4.4% 4.0% 4.2% 4.6% 4.3% 4.3% ROE - adjusted (%) 12.3% 10.2% 18.7% 21.8% 19.7% 16.5% ROA - adjusted (%) 6.6% 5.3% 9.1% 10.5% 9.7% 8.2% NOTE: round to one decimal place Income Statement) METRO F2019 F2018 Total receivables turnover 27.434 26.73 Inventory turnover (use COGS) 13.691 12.128 Accounts payable turnover 11.579 10.51 МЕTRO F2019 F2018 Current ratio L.112 1.173 Quick ratio 0.513 0.5 d Income Statement) МЕTRO F2019 F2018 Debt to total assets* 0.461 0.482 Times interest earned 10.066 23.947 NOTE: Include current portion of long term debt ALSO - lønore all unusual gains and associate's earnings Part I- 4-Year Profitability Trend Analysis (use Empire pg 90 and Metro pg 3) EMPIRE F2020 F2019 F2018 F2017 F2016 Syr Avg 26,588.2 25,142 24,214.6 23,806.2 24,618.8 Sales Profit margin - adjusted (%) 2.2% 1.6% 1.4% 0.8% 1.7% 1.6% ROE - adjusted (%) 15.2% 10.2% 9.3% 5.2% 11.3% 10.3% ROA - adjusted (%) 4.1% 4.3% 4.0% 2.2% 4.5% 3.8% NOTE: round to one decimal place Part 2- Asset Utilization Analysis for last 2 years (use current Balance Sheet & Inc EMPIRE F2020 F2019 Total receivables turnover 49.67 56.6 Inventory turnover (use COGS) 13.397 13.218 Accounts payable turnover 6.76 7.634 Part 3- Liquidity Analysis for last 2 years (use current Balance Sheet) EMPIRE 20XZ 20XY Current ratio 0.802 0.984 Quick ratio 0.435 0.447 Part 4 Debt Utilization Analysis for last 2 years (use current Balance Sheet and I EMPIRE 20XZ 20XY Debt to total assets* 0.726 0.575 Times interest earned 10.972 7.168 NOTE: Include current portion of long term debt
Expert Answer:
Answer rating: 100% (QA)
PART 1 Add the 5 years sales and then divide it by 5 to get the average sales FY16 265582 FY17 25142 FY18 242146 FY19 238062 FY20 246188 Total 1243398 ... View the full answer

Related Book For 
Posted Date:
Students also viewed these accounting questions
-
Financial statement data for Metro Moving Company for 2011 follow: METRO MOVING COMPANY Comparative Statement of Financial Position METRO MOVING COMPANY Statement of Earnings For the year ended...
-
Use Table 13 - 2 for Exercise 21 to 24. See Example 10. Find the compound interest on $2,500 at 0.75% compound daily by Leader Financial bank for 20 days?
-
For the data set 8 6 14 4 (a) Calculate the deviations (x - ) and check to see that they add up to 0. (b) Calculate the variance and the standard deviation. 8 6 14 4
-
Given a shaky economy and high heating costs, more and more households are struggling to pay utility bills (The Wall Street Journal, February, 14, 2008). Particularly hard hit are households with...
-
A hydraulic turbine-generator unit placed at the bottom of a 75-m-high dam accepts water at a rate of 1020 L/s and produces 630 kW of electricity. Determine (a) The overall efficiency of the...
-
Begin by preparing the income statement for LUV Painting for the month of March 2024. (If an input field is not used in the table leave the field empty; do not select a label or enter a zero.)...
-
What are the final two steps a researcher should do after presenting the research findings to the decision makers?
-
High Corporation incorporates on May 1 and begins business on May 10 of the current year. What alternative tax years can High elect to report its initial years income?
-
8 Sean has a job mowing grass for the city, using a riding mower. He can mow of an acre per hour. How long will he need to mow the 3-acre city park? He will need hours to mow the park. (Type an...
-
Rachel Cook is very concerned. Until recently, she has always had the golden touch, having successfully launched two start- up companies that made her a very wealthy woman. However, the timing could...
-
A big part of the work-energy theorem is being able to calculate the work done by all of the forces external to your system. In this class, we use the full definition of work: W Fas =/ Pabd rather...
-
Using complete sentences post a detailed response to the following. In a business, it's important to regularly check that contact information is correct. How would you go about checking the accuracy...
-
One of the risk parameters is susceptible to change, briefly explain this parameter concerning any project of your choice.
-
c) Identify two self-care strategies that you could use when working in crisis situations, such as this situation with Miriam.
-
Rodrigo, a non-resident citizen, deposited his $2,000,000 savings in a 2-year time deposit in Blue Bank, a depositary bank under the expanded foreign currency deposit system. The deposit pays 8%...
-
Mateo is a 8 month old infant who plays a baby on a tv show.he gets paid 1000 per show .he has 20 shows during the year. is this income taxable to little mateo ?
-
It is said that Family Law used to contain fundamentally Divorce and some Child Protection. Name the main scholastic who have endeavored to distinguish the key components which now characterize...
-
If |62x|>9, which of the following is a possible value of x? A. 2 B. 1 C. 0 D. 4 E. 7
-
During a period of severe inflation, a bond offered a nominal HPR of 80% per year. The inflation rate was 70% per year. a. What was the real HPR on the bond over the year? b. Compare this real HPR to...
-
Suppose that sending an analyst to an executive education program will raise the precision of the analysts forecasts as measured by R -square by .01. How might you put a dollar value on this...
-
Consider an 8% coupon bond selling for $953.10 with 3 years until maturity making annual coupon payments. The interest rates in the next 3 years will be, with certainty, r1 = 8%, r2 = 10%, and r3 =...
-
Consider the multiple linear regression model fit to the baseball data in Problem 3.41. Problem 3.41 Consider the 2016 major league baseball data in Table B.22. While team ERA was useful in...
-
Consider the simple linear regression model fit to the rental price data from Problem 2.36. Data From Problem 2.36 Table B.24 contains data on median family home rental price and other data for 51 US...
-
Consider the multiple linear regression model fit to the rental price data in Problem 3.42. Problem 3.42 Table B.24 contains data on median family home rental price and other data for 51 US cities....

Study smarter with the SolutionInn App