

Question: Article Link: https://bit.ly/3fbNtrF The following graph provides a stylised representation of the effects of the policy proposed by the government to correct for the externality

Article Link: https://bit.ly/3fbNtrF
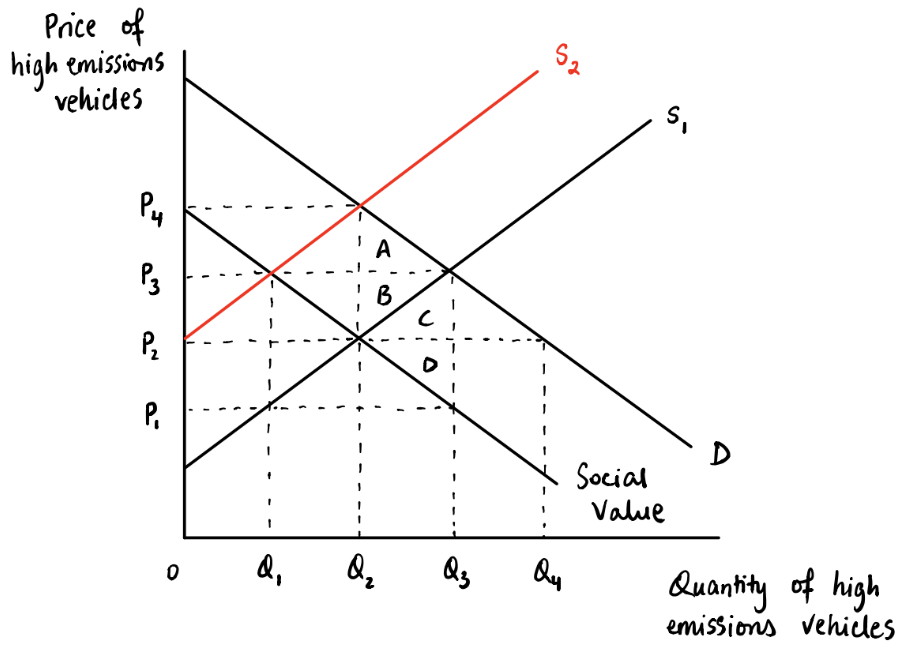
The following graph provides a stylised representation of the effects of the policy proposed by the government to correct for the externality (in the graph, S2 is the supply curve after the policy is implemented).
Price of high emissions vehicles A X :0 NO Wo D + D - Social F- - - - - - - Value 0 Qy Quantity of high emissions vehicles
Step by Step Solution
There are 3 Steps involved in it
1 Expert Approved Answer
Step: 1 Unlock

Question Has Been Solved by an Expert!
Get step-by-step solutions from verified subject matter experts
Step: 2 Unlock
Step: 3 Unlock