

Question: As a simple example, consider the historical data for a certain plant. Enter the data Into EXCEL and analyze it to answer the following items.

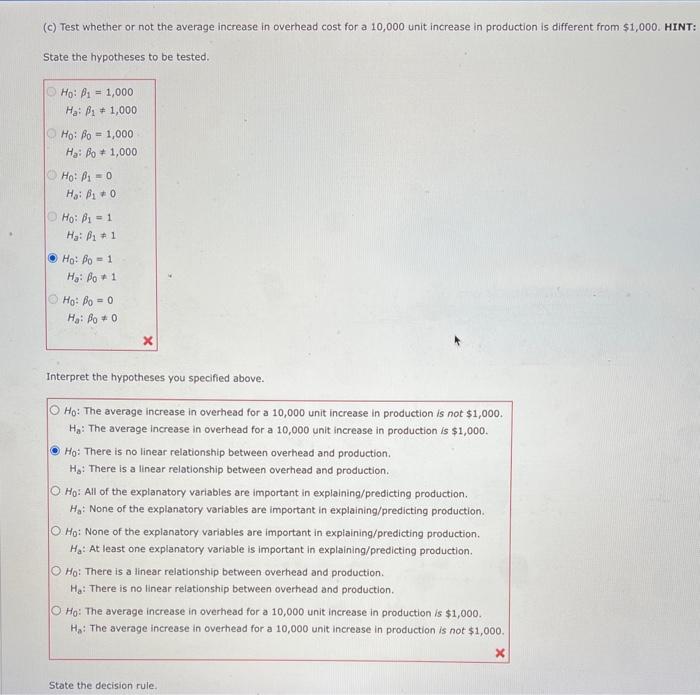


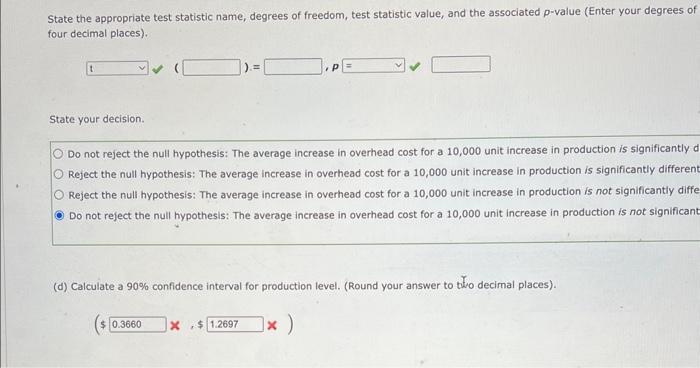
As a simple example, consider the historical data for a certain plant. Enter the data Into EXCEL and analyze it to answer the following items. Production (In 10,000) units: 5 6 7 9 10 11 Overhead costs (In $1,000): 13 11.4 13 16 15.6 15.1 17.3(c) Test whether or not the average increase in overhead cost for a 10,000 unit increase in production is different from $1,000. HINT: State the hypotheses to be tested. O Ho: P1 = 1,000 Ha: P1 # 1,000 Ho: 80 = 1,000 Hai Po # 1,000 Ho: /1 = 0 Hai Bio O Ho: P1 = 1 Ha: P1 # 1 O Ho: Fo = 1 Ha: Do * 1 O Ho: Do = 0 Ha: Fo * 0 X Interpret the hypotheses you specified above. Ho: The average increase in overhead for a 10,000 unit increase in production is not $1,000. Ha: The average increase in overhead for a 10,000 unit increase in production is $1,000. Ho: There is no linear relationship between overhead and production. He: There is a linear relationship between overhead and production. O. Ho: All of the explanatory variables are important in explaining/predicting production, Ha: None of the explanatory variables are important in explaining/predicting production. O. Ho: None of the explanatory variables are important in explaining/predicting production. He: At least one explanatory variable is important in explaining/predicting production. O Ho: There is a linear relationship between overhead and production. Ha: There is no linear relationship between overhead and production. O Ho: The average increase in overhead for a 10,000 unit increase in production is $1,000. Ha: The average increase in overhead for a 10,000 unit Increase in production is not $1,000. X State the decision rule.$1,000. HINT: Keep in mind the measurement units of the variables. Use a 10% level of significance.State the appropriate test statistic name, degrees of freedom, test statistic value, and the associated p-value (Enter your degrees of four decimal places). P State your decision. Do not reject the null hypothesis: The average increase in overhead cost for a 10,000 unit increase in production is significantly d Reject the null hypothesis: The average increase in overhead cost for a 10,000 unit increase in production is significantly different O Reject the null hypothesis: The average increase in overhead cost for a 10,000 unit Increase in production is not significantly diffe Do not reject the null hypothesis: The average increase in overhead cost for a 10,000 unit increase in production is not significant (d) Calculate a 90% confidence interval for production level. (Round your answer to two decimal places). 0.3660 X .$ 1.2697 x )
Step by Step Solution
There are 3 Steps involved in it

Get step-by-step solutions from verified subject matter experts