

Question: As close to the syntax below as possible... The Region 1 Basketball Coaches Association has a sequential file that contains the win/loss records for
 \
\
As close to the syntax below as possible...
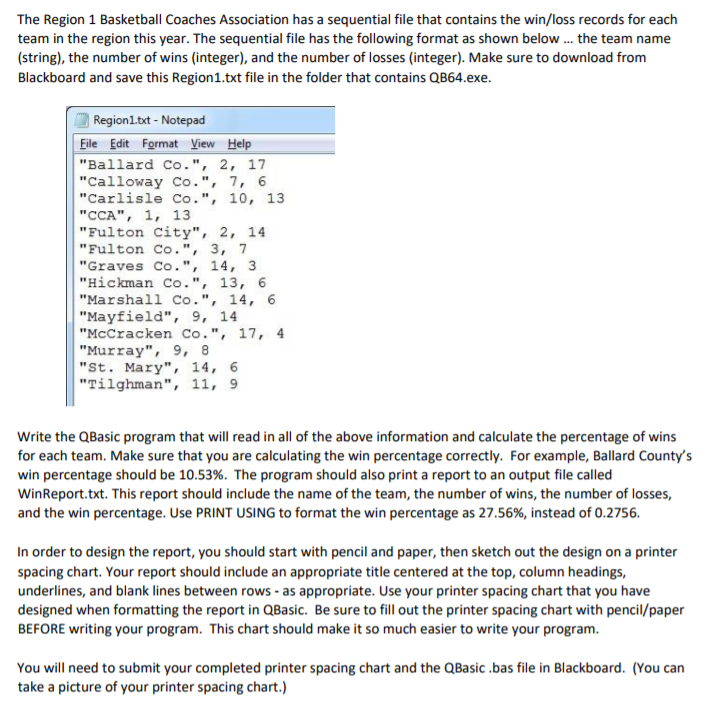
The Region 1 Basketball Coaches Association has a sequential file that contains the win/loss records for each team in the region this year. The sequential file has the following format as shown belowthe team name (string), the number of wins (integer), and the number of losses (integer). Make sure to download from Blackboard and save this Region1.txt file in the folder that contains QB64.exe Region1.txt-Notepad File Edit Format View Help "Ballard Co.", 2, 17 "Calloway Co.", 7, 6 "Carlisle Co.", 10, 13 "CCA", 1, 13 "Fulton City",2,14 "Fulton Co.", 3, 7 "Graves Co., 14, 3 "Hickman Co.", 13, 6 "Marshall Co., 14, 6 "Mayfield", 9, 14 "McCracken Co., 17, 4 "Murray", 9, 8 "St. Mary, 14, 6 "Tilghman", 11, 9 Write the QBasic program that will read in all of the above information and calculate the percentage of wins for each team. Make sure that you are calculating the win percentage correctly. For example, Ballard County's win percentage should be 10.53%. The program should also print a report to an output file called WinReport.txt. This report should include the name of the team, the number of wins, the number of losses, and the win percentage. Use PRINT USING to format the win percentage as 27.56%, instead of 0.2756. In order to design the report, you should start with pencil and paper, then sketch out the design on a printer spacing chart. Your report should include an appropriate title centered at the top, column headings, underlines, and blank lines between rows-as appropriate. Use your printer spacing chart that you have designed when formatting the report in QBasic. Be sure to fill out the printer spacing chart with pencil/paper BEFORE writing your program. This chart should make it so much easier to write your program You will need to submit your completed printer spacing chart and the QBasic bas file in Blackboard. (You can take a picture of your printer spacing chart.) The Region 1 Basketball Coaches Association has a sequential file that contains the win/loss records for each team in the region this year. The sequential file has the following format as shown belowthe team name (string), the number of wins (integer), and the number of losses (integer). Make sure to download from Blackboard and save this Region1.txt file in the folder that contains QB64.exe Region1.txt-Notepad File Edit Format View Help "Ballard Co.", 2, 17 "Calloway Co.", 7, 6 "Carlisle Co.", 10, 13 "CCA", 1, 13 "Fulton City",2,14 "Fulton Co.", 3, 7 "Graves Co., 14, 3 "Hickman Co.", 13, 6 "Marshall Co., 14, 6 "Mayfield", 9, 14 "McCracken Co., 17, 4 "Murray", 9, 8 "St. Mary, 14, 6 "Tilghman", 11, 9 Write the QBasic program that will read in all of the above information and calculate the percentage of wins for each team. Make sure that you are calculating the win percentage correctly. For example, Ballard County's win percentage should be 10.53%. The program should also print a report to an output file called WinReport.txt. This report should include the name of the team, the number of wins, the number of losses, and the win percentage. Use PRINT USING to format the win percentage as 27.56%, instead of 0.2756. In order to design the report, you should start with pencil and paper, then sketch out the design on a printer spacing chart. Your report should include an appropriate title centered at the top, column headings, underlines, and blank lines between rows-as appropriate. Use your printer spacing chart that you have designed when formatting the report in QBasic. Be sure to fill out the printer spacing chart with pencil/paper BEFORE writing your program. This chart should make it so much easier to write your program You will need to submit your completed printer spacing chart and the QBasic bas file in Blackboard. (You can take a picture of your printer spacing chart.)
Step by Step Solution
There are 3 Steps involved in it

Get step-by-step solutions from verified subject matter experts