

Question: As discussed in class, Excel is a useful tool in developing equations that represent an experimental data set. In this assignment. you will compare common
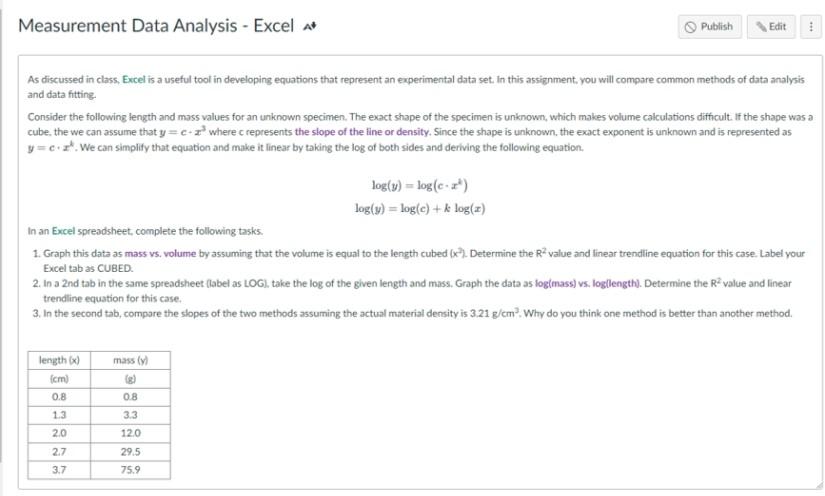
As discussed in class, Excel is a useful tool in developing equations that represent an experimental data set. In this assignment. you will compare common methods of data analysis and data fitting. Consider the following length and mass values for an unknown specimen. The exact shape of the specimen is unknown, which makes volume calculations difticult. If the shape was a cube, the we can assume that y=cx3. Where c represents the slope of the line or density. Since the shape is unknown, the exact exponent is unknown and is represented as y=cxk. We can simplify that equation and make it linear by taking the log of both sides and deriving the following equation. log(y)=log(cxb)log(y)=log(c)+klog(x) In an Excel spreadsheet, complete the following tasks. 1. Graph this data as mass vs. volume by assuming that the volume is equal to the length cubed (x2). Determine the R2 value and linear trendline equation for this case. Label your Excel tab as CUBED. 2. In a 2 nd tab in the same spreadsheet (Iabel as LOG), take the log of the given length and mass, Graph the data as log(mass) vs. log(length). Determine the R2 value and linear trendline equation for this case. 3. In the second tab, compore the slopes of the two methods assuming the actual material density is 3.21g/cm3. Why do you think one method is better than another method
Step by Step Solution
There are 3 Steps involved in it

Get step-by-step solutions from verified subject matter experts