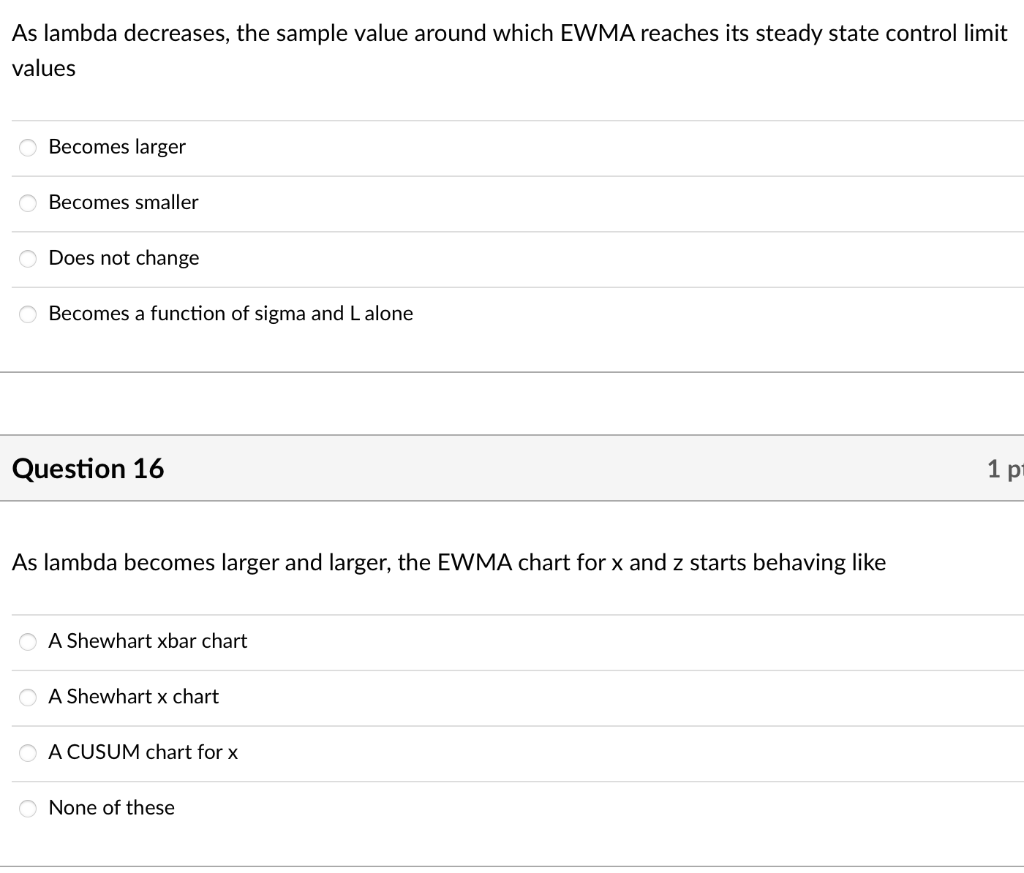
Question: As lambda decreases, the sample value around which EWMA reaches its steady state control limit values Becomes larger Becomes smaller Does not change Becomes a

As lambda decreases, the sample value around

As lambda decreases, the sample value around which EWMA reaches its steady state control limit values Becomes larger Becomes smaller Does not change Becomes a function of sigma and L alone Question 16 1 p As lambda becomes larger and larger, the EWMA chart for x and z starts behaving like A Shewhart xbar chart O A Shewhart x chart O A CUSUM chart for x O None of these

Step by Step Solution

There are 3 Steps involved in it

1 Expert Approved Answer
Step: 1 Unlock blur-text-image
Question Has Been Solved by an Expert!

Get step-by-step solutions from verified subject matter experts

Step: 2 Unlock
Step: 3 Unlock

Students Have Also Explored These Related General Management Questions!