

Question: As marked on the graph, the vertical axis (0Y) measures the Price Level. What does the horizontal axis 0X of this graph measure? a) Real
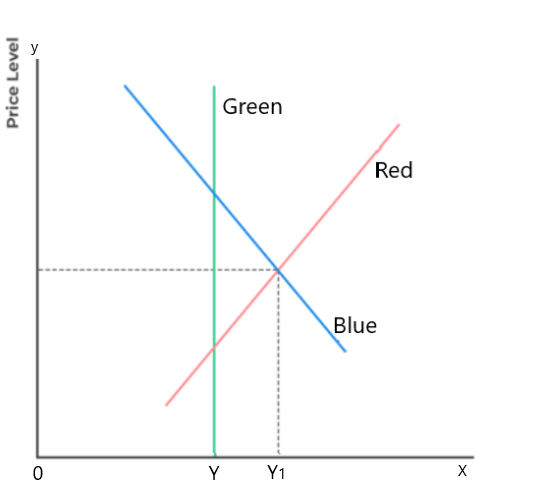
As marked on the graph, the vertical axis (0Y) measures the Price Level.What does the horizontal axis 0X of this graph measure?
a) Real GDP
b) Actual GDP
c) Potential GDP
d) labor force
e) Time
f) None of the above
2. How much is potential GDP?
a) 0Y
b) 0Y1
c) 0X
d) YY1
e) Y1X
f) None of the above
3. How much is the actual GDP?
a) 0Y
b) 0Y1
c) 0X
d) YY1
e) Y1X
4. Is there any output gap?
a) Yes.
b) No.
5. If yes, what is the name of the GDP gap?
a) Monetary gap
b) Fiscal gap
c) Inflationary gap
d) Recessionary gap
f) AD gap
None of the above
6. Which colored curve on the graph represents SRAS.
a) Red
b) Green
c) Blue
d) None of the above
7. Which colored curve on the graph represents AD.
a) Red
b) Green
c) Blue
d) None of the above
Step by Step Solution
There are 3 Steps involved in it

Get step-by-step solutions from verified subject matter experts