

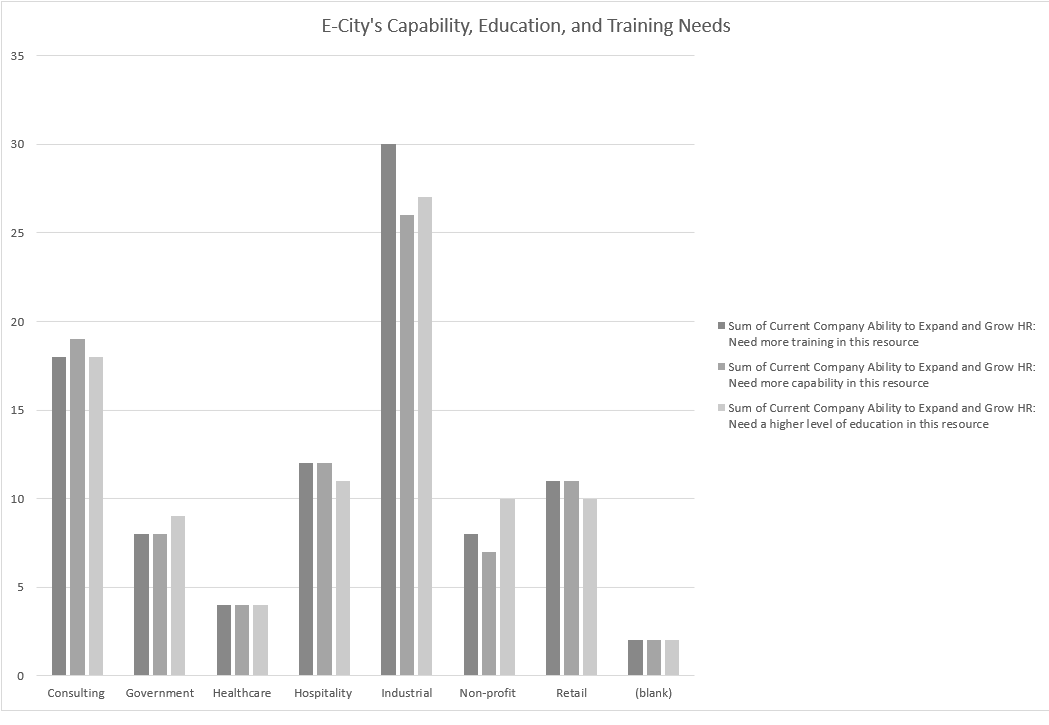
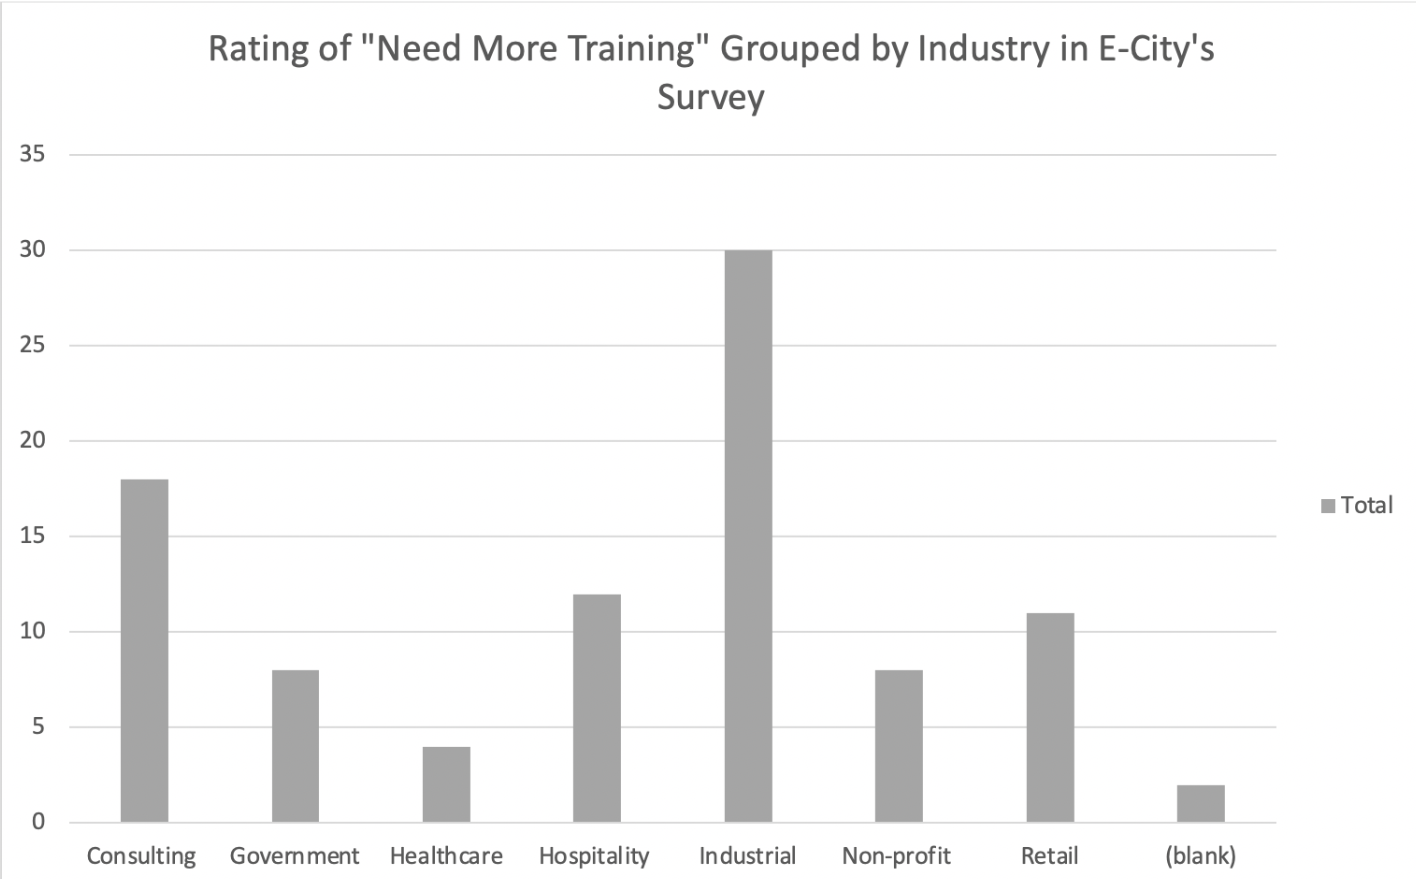
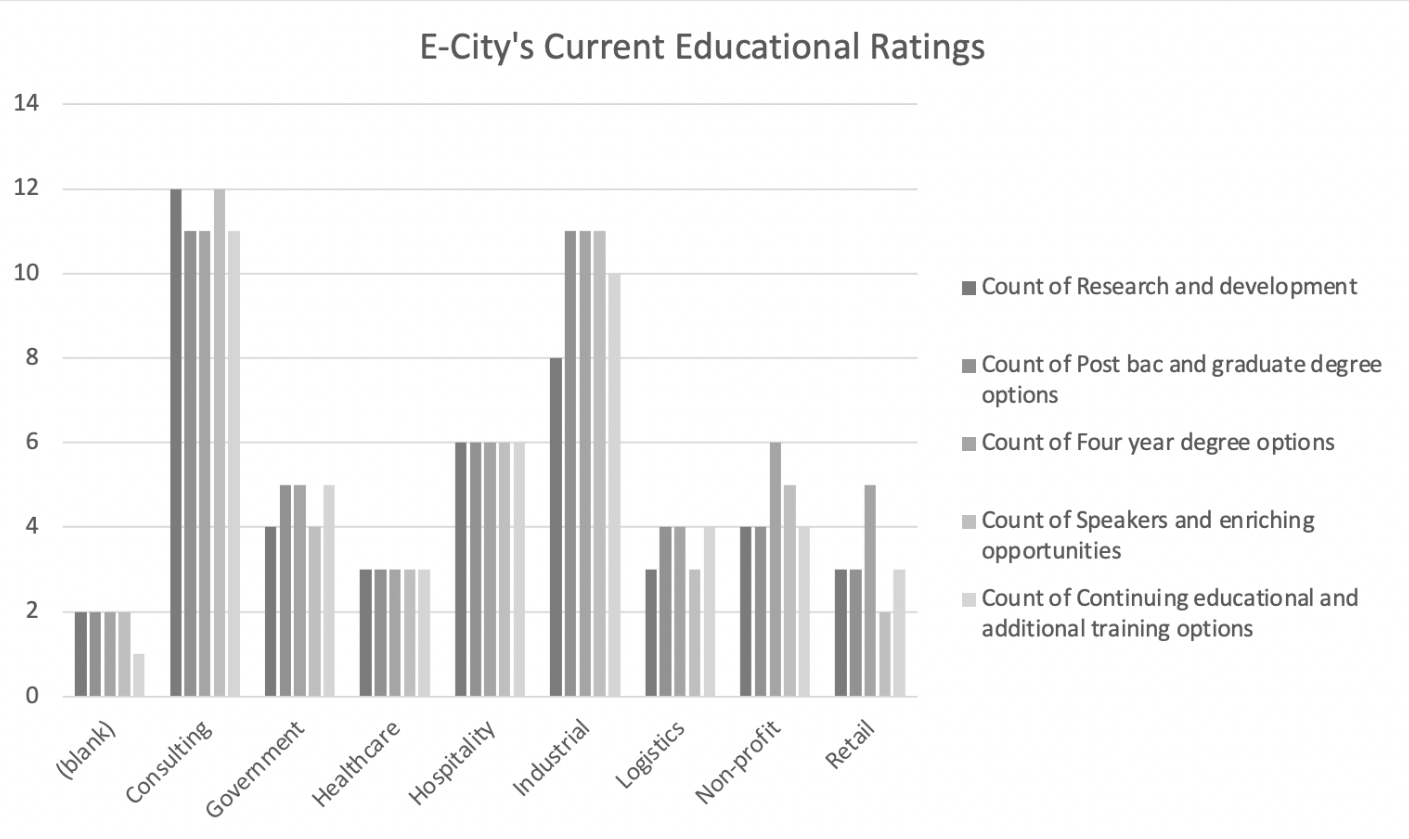
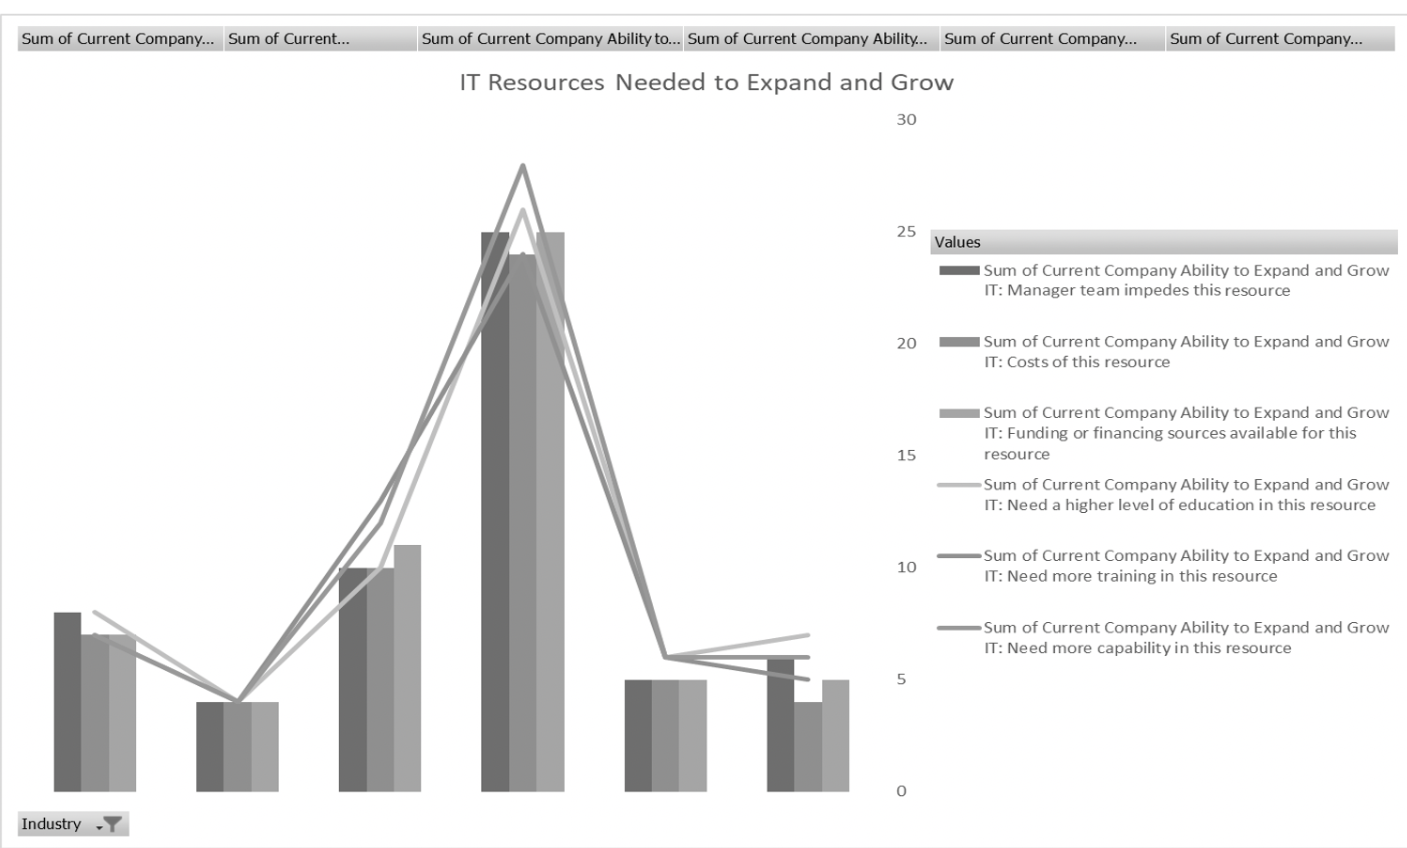
Question: As may notice, data in this format would be difficult to use. We need to take this raw data and reformat it to graphically represent
As may notice, data in this format would be difficult to use. We need to take this raw data and reformat it to graphically represent and communicate the information. This is known as data visualization. Without data visualization, it is virtually impossible to make sound decisions on what the E-University can do to make a socio-economic impact.
Therefore, use this data to create several charts. Be sure to select all the tabs to review each figure.
- Choose three charts that will help you determine how to make a positive impact on E-City's local economy. Write three sentences about actionable items that you intend to execute because of the data visualized in the chart.
- Which of the charts do not aid in strategic decision-making? Why were the charts not helpful? How do you think the data should be visualized differently? 2-3 sentences
- How can you use data visualization to make future decisions at your workplace? 1 sentence
Step by Step Solution
There are 3 Steps involved in it
1 Expert Approved Answer
Step: 1 Unlock

Question Has Been Solved by an Expert!
Get step-by-step solutions from verified subject matter experts
Step: 2 Unlock
Step: 3 Unlock