

Question: As part of a manufacturing quality control process, a sample of 60 small solid rocket motors is selected at random from a production batch of
As part of a manufacturing quality control process, a sample of 60 small solid rocket motors is selected at random from a production batch of 10,000 and test fired. One of the quality parameters is the Total Impulse delivered by the engine which is recorded in units of Newton-seconds (N-s). 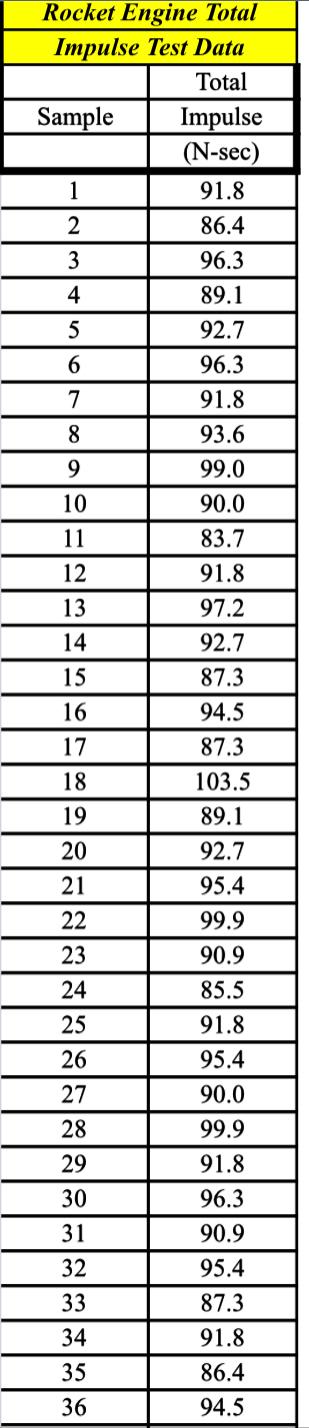
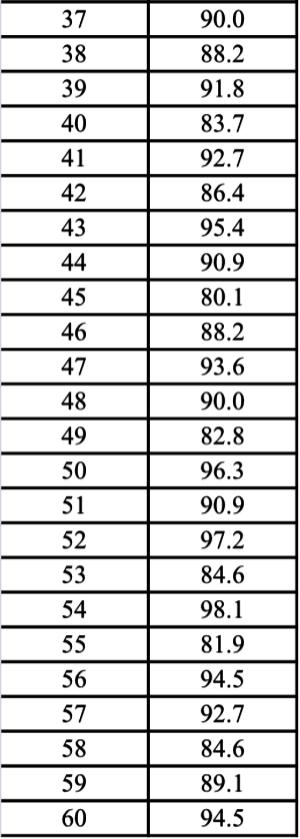 Perform the following statistical analyses for this data set: a. Calculate the mean and median values of the total impulse for the data set. b. Calculate the appropriate form of the standard deviation for making statistical projections about the production batch. c. Prepare a histogram plot showing the distribution of the data. Use a bin size that you feel illustrates the distribution appropriately. d. How does the percentage of data points lying within +/-1 and +/-2 standard deviations compare with the percentage you would expect from the normal distribution (Bell curve)? e. Now, making an assumption that the total impulse values for the batch follows a normal distribution, project how many motors in the batch of 10,000 do you estimate will be duds that deliver less than 80 N-s total impulse?
Rocket Engine Total Impulse Test Data Total Sample Impulse (N-sec) 1 91.8 2 86.4 3 96.3 4 89.1 5 92.7 6 96.3 7 91.8 8 93.6 9 99.0 10 90.0 11 83.7 12 91.8 13 97.2 14 92.7 15 87.3 16 94.5 17 87.3 18 103.5 19 89.1 20 92.7 21 95.4 22 99.9 23 90.9 24 85.5 25 91.8 26 95.4 27 90.0 28 99.9 29 91.8 30 96.3 31 90.9 32 95.4 33 87.3 34 91.8 35 86.4 36 94.5 37 38 39 40 41 42 43 44 45 90.0 88.2 91.8 83.7 92.7 86.4 95.4 90.9 80.1 88.2 93.6 90.0 82.8 96.3 90.9 97.2 84.6 98.1 46 47 48 49 50 51 52 53 54 55 56 57 58 81.9 94.5 92.7 84.6 89.1 94.5 59 60 Rocket Engine Total Impulse Test Data Total Sample Impulse (N-sec) 1 91.8 2 86.4 3 96.3 4 89.1 5 92.7 6 96.3 7 91.8 8 93.6 9 99.0 10 90.0 11 83.7 12 91.8 13 97.2 14 92.7 15 87.3 16 94.5 17 87.3 18 103.5 19 89.1 20 92.7 21 95.4 22 99.9 23 90.9 24 85.5 25 91.8 26 95.4 27 90.0 28 99.9 29 91.8 30 96.3 31 90.9 32 95.4 33 87.3 34 91.8 35 86.4 36 94.5 37 38 39 40 41 42 43 44 45 90.0 88.2 91.8 83.7 92.7 86.4 95.4 90.9 80.1 88.2 93.6 90.0 82.8 96.3 90.9 97.2 84.6 98.1 46 47 48 49 50 51 52 53 54 55 56 57 58 81.9 94.5 92.7 84.6 89.1 94.5 59 60
Step by Step Solution
There are 3 Steps involved in it

Get step-by-step solutions from verified subject matter experts