

Question: As per the data below, looking for a breakdown of Yahoo financials. Have tried a number of methods, however can't seem to get a clean
As per the data below, looking for a breakdown of Yahoo financials. Have tried a number of methods, however can't seem to get a clean layout. Looking for some assistance. Trying to break out the financial data into a visual chart, by year.
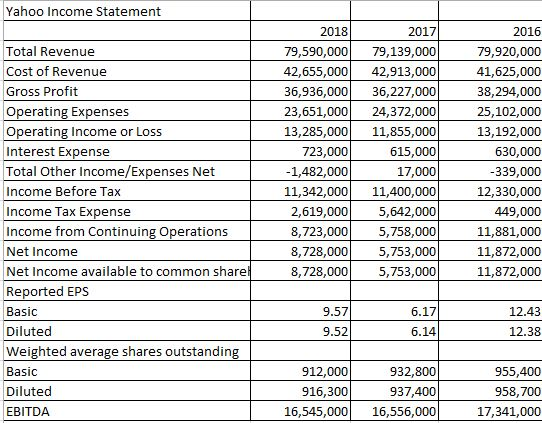
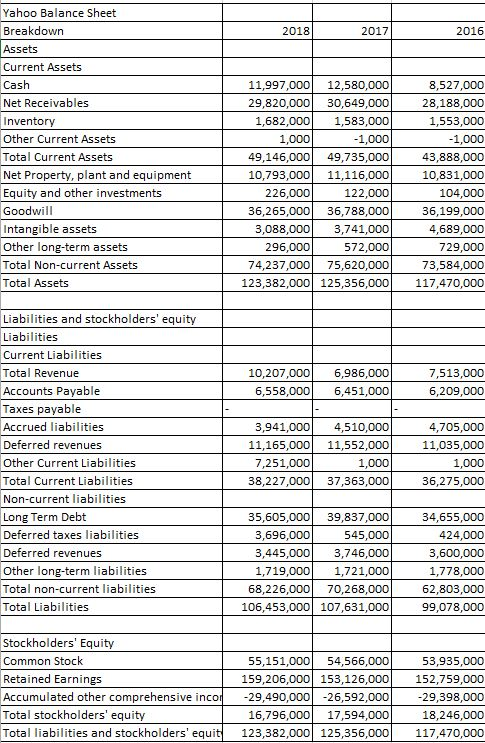
Yahoo Income Statement Total Revenue Cost of Revenue Gross Profit Operating Expenses Operating Income or Loss Interest Expense Total Other Income/Expenses Net Income Before Tax Income Tax Expense Income from Continuing Operations Net Income Net Income available to common sharel Reported EPS Basic Diluted Weighted average shares outstanding Basic Diluted EBITDA 2018 79,590,000 42,655,000 36,936,000 23,651,000 13,285,000 723,000 -1,482,000 11,342,000 2,619,000 8,723,000 8,728,000 8,728,000 2017 79,139,000 42,913,000 36,227,000 24,372,000 11,855,000 615,000 17,000 11,400,000 5,642,000 5,758,000 5,753,000 5,753,000 2016 79,920,000 41,625,000 38,294,000 25,102,000 13,192,000 630,000 -339,000 12,330,000 449,000 11,881,000 11,872,000 11,872,000 9.57 9.52 6.17 6.14 12.43 12.38 912,000 916,300 16,545,000 932,800 937,400 16,556,000 955,400 958,700 17,341,000 2018 2017 2016 Yahoo Balance Sheet Breakdown Assets Current Assets Cash Net Receivables Inventory Other Current Assets Total Current Assets Net Property, plant and equipment Equity and other investments Goodwill Intangible assets Other long-term assets Total Non-current Assets Total Assets 11,997,000 12,580,000 29,820,000 30,649,000 1,682,000 1,583,000 1,000 1,000 49,146,000 49,735,000 10,793,000 11,116,000 226,000 122,000 36,265,000 36,788,000 3,088,000 3,741,000 296,000 572,000 74,237,000 75,620,000| 123,382,000 125,356,000 8,527,000 28,188,000 1,553,000 -1,000 43,888,000 10,831,000 104,000 36,199,000 4,689,000 729,000 73,584,000 117,470,000 10,207,000| 6,558,000 6,986,000 6,451,000 7,513,000 6,209,000 - Liabilities and stockholders' equity Liabilities Current Liabilities Total Revenue Accounts Payable Taxes payable Accrued liabilities Deferred revenues Other Current Liabilities Total Current Liabilities Non-current liabilities Long Term Debt Deferred taxes liabilities Deferred revenues Other long-term liabilities Total non-current liabilities Total Liabilities 3,941,000 11,165,000 7,251,000 38,227,000 4,510,000 11,552,000 1,000 37,363,000 4,705,000 11,035,000 1,000 36,275,000 35,605,000 3,696,000 3,445,000 1,719,000 68,226,000 106,453,000 39,837,000 545,000 3,746,000 1,721,000 70,268,000 107,631,000 34,655,000 424,000 3,600,000 1,778,000 62,803,000 99,078,000 Stockholders' Equity Common Stock Retained Earnings Accumulated other comprehensive incor Total stockholders' equity Total liabilities and stockholders' equit 55,151,000 54,566,000 159,206,000 153,126,000 -29,490,000 -26,592,000 16,796,000 17,594,000 123,382,000 125,356,000 53,935,000 152,759,000 -29,398,000 18,246,000 117,470,000 Yahoo Income Statement Total Revenue Cost of Revenue Gross Profit Operating Expenses Operating Income or Loss Interest Expense Total Other Income/Expenses Net Income Before Tax Income Tax Expense Income from Continuing Operations Net Income Net Income available to common sharel Reported EPS Basic Diluted Weighted average shares outstanding Basic Diluted EBITDA 2018 79,590,000 42,655,000 36,936,000 23,651,000 13,285,000 723,000 -1,482,000 11,342,000 2,619,000 8,723,000 8,728,000 8,728,000 2017 79,139,000 42,913,000 36,227,000 24,372,000 11,855,000 615,000 17,000 11,400,000 5,642,000 5,758,000 5,753,000 5,753,000 2016 79,920,000 41,625,000 38,294,000 25,102,000 13,192,000 630,000 -339,000 12,330,000 449,000 11,881,000 11,872,000 11,872,000 9.57 9.52 6.17 6.14 12.43 12.38 912,000 916,300 16,545,000 932,800 937,400 16,556,000 955,400 958,700 17,341,000 2018 2017 2016 Yahoo Balance Sheet Breakdown Assets Current Assets Cash Net Receivables Inventory Other Current Assets Total Current Assets Net Property, plant and equipment Equity and other investments Goodwill Intangible assets Other long-term assets Total Non-current Assets Total Assets 11,997,000 12,580,000 29,820,000 30,649,000 1,682,000 1,583,000 1,000 1,000 49,146,000 49,735,000 10,793,000 11,116,000 226,000 122,000 36,265,000 36,788,000 3,088,000 3,741,000 296,000 572,000 74,237,000 75,620,000| 123,382,000 125,356,000 8,527,000 28,188,000 1,553,000 -1,000 43,888,000 10,831,000 104,000 36,199,000 4,689,000 729,000 73,584,000 117,470,000 10,207,000| 6,558,000 6,986,000 6,451,000 7,513,000 6,209,000 - Liabilities and stockholders' equity Liabilities Current Liabilities Total Revenue Accounts Payable Taxes payable Accrued liabilities Deferred revenues Other Current Liabilities Total Current Liabilities Non-current liabilities Long Term Debt Deferred taxes liabilities Deferred revenues Other long-term liabilities Total non-current liabilities Total Liabilities 3,941,000 11,165,000 7,251,000 38,227,000 4,510,000 11,552,000 1,000 37,363,000 4,705,000 11,035,000 1,000 36,275,000 35,605,000 3,696,000 3,445,000 1,719,000 68,226,000 106,453,000 39,837,000 545,000 3,746,000 1,721,000 70,268,000 107,631,000 34,655,000 424,000 3,600,000 1,778,000 62,803,000 99,078,000 Stockholders' Equity Common Stock Retained Earnings Accumulated other comprehensive incor Total stockholders' equity Total liabilities and stockholders' equit 55,151,000 54,566,000 159,206,000 153,126,000 -29,490,000 -26,592,000 16,796,000 17,594,000 123,382,000 125,356,000 53,935,000 152,759,000 -29,398,000 18,246,000 117,470,000
Step by Step Solution
There are 3 Steps involved in it

Get step-by-step solutions from verified subject matter experts