

Question: As shown below, we created a joint plot with Leg Building Square Feet on the x-axis, and Leg Sale Price on the yaxis. In addition,
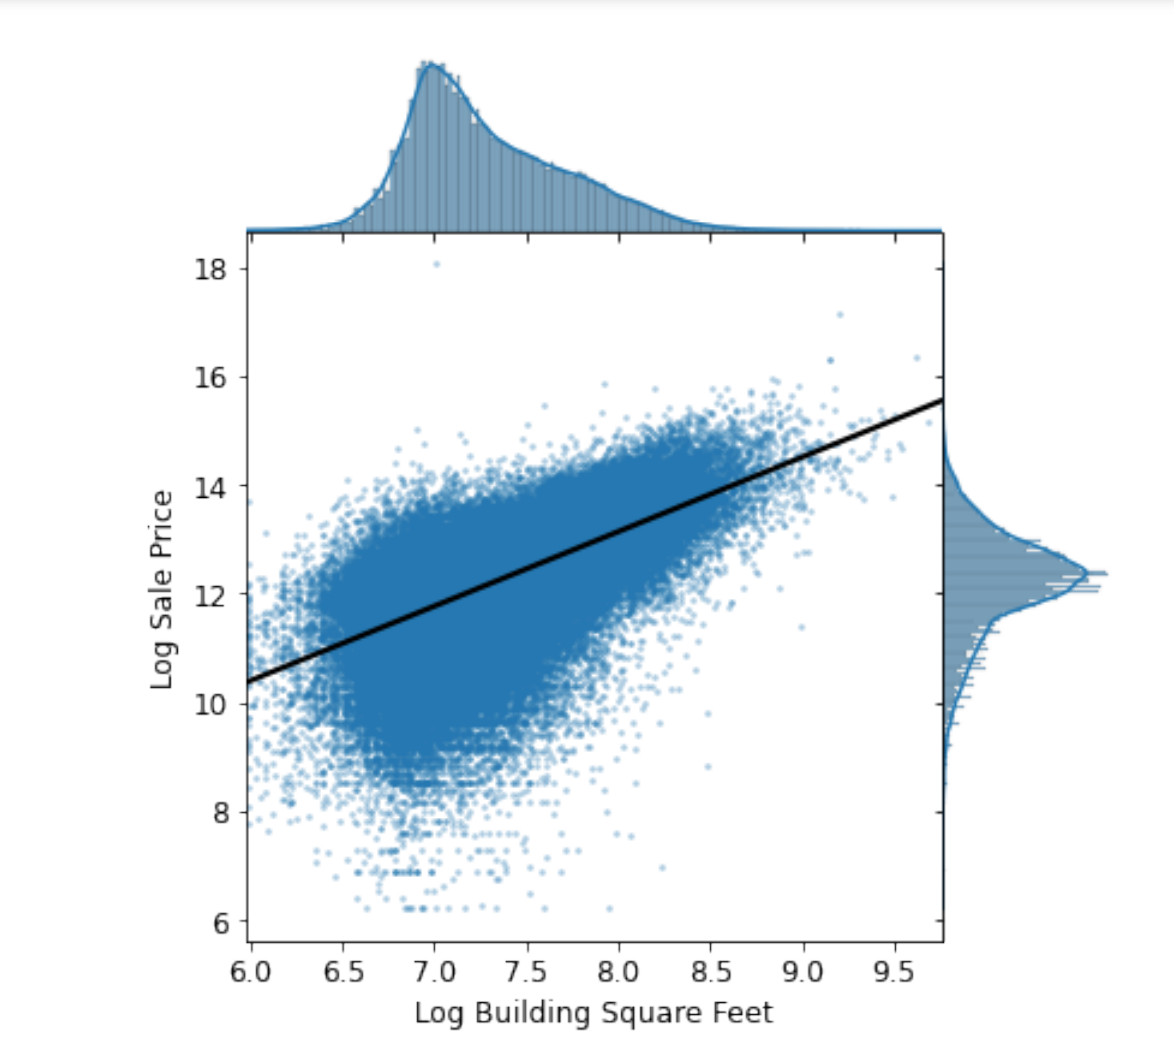
As shown below, we created a joint plot with Leg Building Square Feet on the x-axis, and Leg Sale Price on the yaxis. In addition, we t a simple linear regression line through the bivariate scatter plot in the middle. Based on the following plot, does there exist a correlation between Log Sale Price and Leg Building Square Feet? Would Log Building Square Feet make a good candidate as one of the features for our model? 18 16 14 Log Sale Price 12 10 8 6 6.0 6.5 7.0 7.5 8.0 8.5 9.0 9.5 Log Building Square Feet
Step by Step Solution
There are 3 Steps involved in it
1 Expert Approved Answer
Step: 1 Unlock

Question Has Been Solved by an Expert!
Get step-by-step solutions from verified subject matter experts
Step: 2 Unlock
Step: 3 Unlock