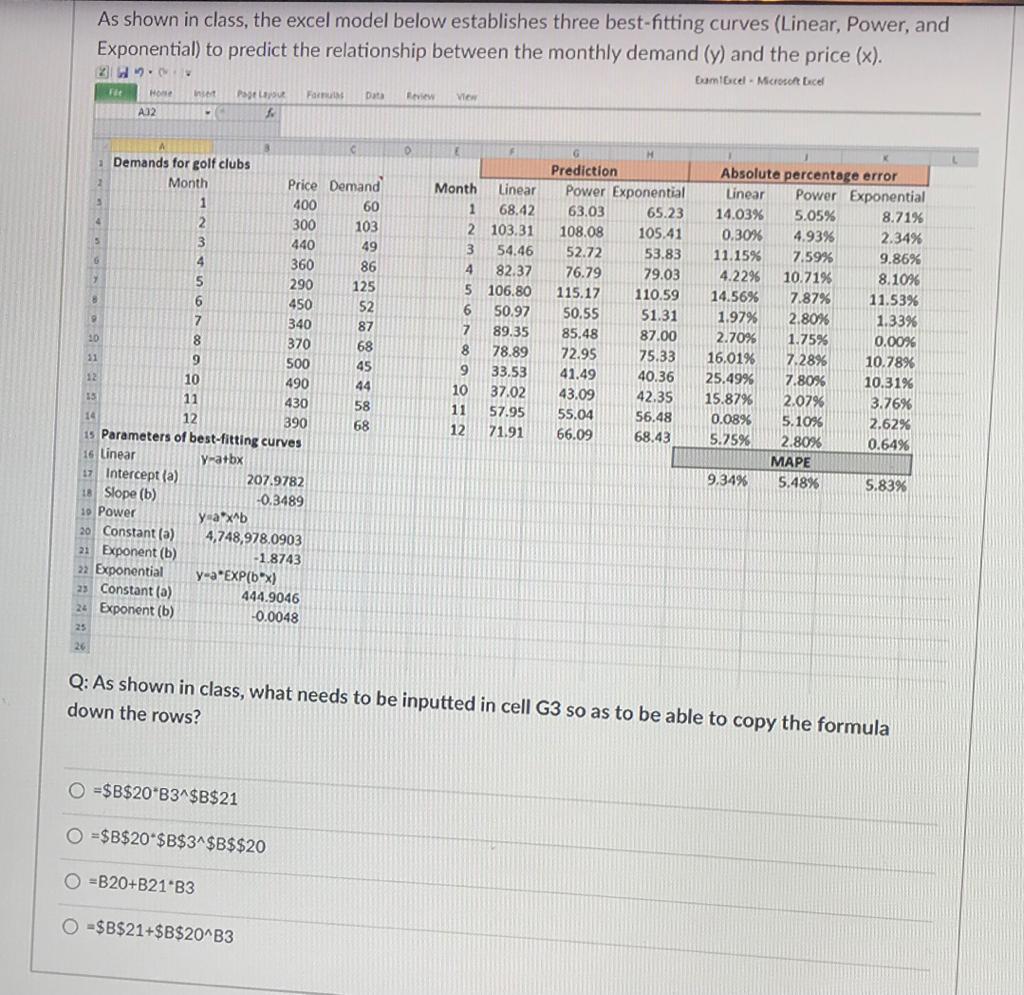
Question: As shown in class, the excel model below establishes three best-fitting curves (Linear, Power, and Exponential) to predict the relationship between the monthly demand (y)

As shown in class, the excel model below

As shown in class, the excel model below establishes three best-fitting curves (Linear, Power, and Exponential) to predict the relationship between the monthly demand (y) and the price (x). 2]A -) ( ; ExamExcel - Microsoft Excel Inst Page Farm Data View A12 5 G 3 1 Demands for golf clubs Month Price Demand 1 400 60 2 300 103 5 3 440 49 4 360 86 5 290 125 6 450 52 9 7 340 87 10 8 370 68 9 500 45 12 10 490 44 35 11 430 58 14 12 390 68 15 Parameters of best-fitting curves 16 linear y-atbx 11 Intercept(a) 207.9782 18 Slope (b) -0.3489 10 Power y ax^b 20 Constant () 4,748,978.0903 21 Exponent (b) -1.8743 22 Exponential y-a "EXP(bx) 23 Constant () 444.9046 24 Exponent (b) -0.0048 25 Month Linear 1 68.42 2 103.31 3 54.46 4 82.37 5 106.80 6 50.97 7 89.35 8 78.89 9 33.53 10 37.02 11 57.95 12 71.91 G M Prediction Power Exponential 63.03 65.23 108.08 105.41 52.72 53.83 76.79 79.03 115.17 110.59 50.55 51.31 85.48 87.00 72.95 75.33 41.49 40.36 43.09 42.35 55.04 56.48 66.09 68.43 Absolute percentage error Linear Power Exponential 14.03% 5.05% 8.71% 0.30% 4.93% 2.34% 11.15% 7.59% 9.86% 4.2296 10.71% 8.10% 14.56% 7.87% 11.53% 1.97% 2.80% 1.33% 2.70% 1.75% 0.00% 16.01% 7.28% 10.78% 25.49% 7.80% 10.31% 15.879 2.07% 3.76% 0.08% 5.1095 2.62% 2.80% 0.64% MAPE 9.34% 5.48% 5.83% 5.25% Q: As shown in class, what needs to be inputted in cell G3 so as to be able to copy the formula down the rows? O =$B$20 B3^$B$21 O =$B$20-$B$34 $B$$20 =B20+B21-B3 O =$B$21+$B$20^B3

Step by Step Solution

There are 3 Steps involved in it

1 Expert Approved Answer
Step: 1 Unlock blur-text-image
Question Has Been Solved by an Expert!

Get step-by-step solutions from verified subject matter experts

Step: 2 Unlock
Step: 3 Unlock

Students Have Also Explored These Related General Management Questions!