

Question: As soon as possible please base in the tables answer the questions Table 1: Applying and Analyzing Cost-Benefit Analysis Plan Total first Cost Annual Capital
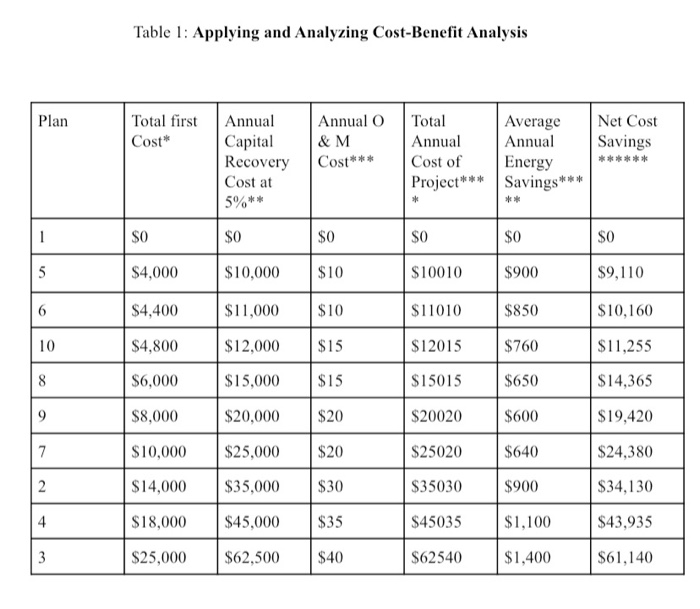
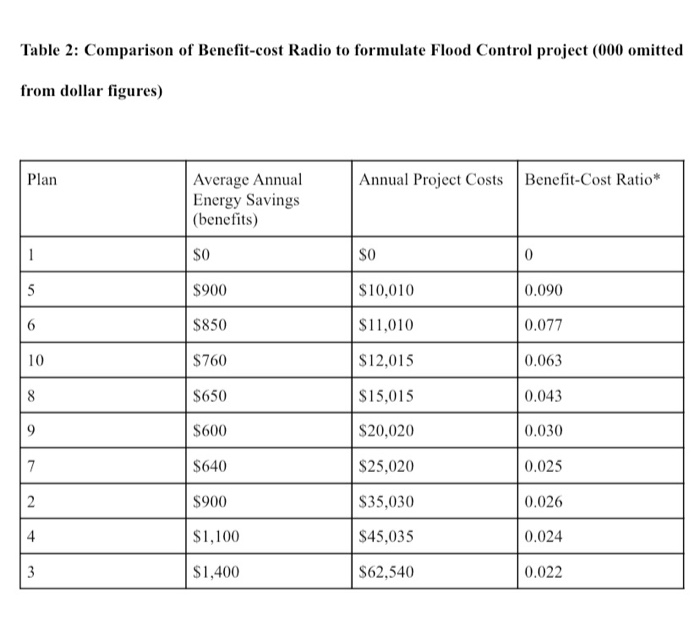
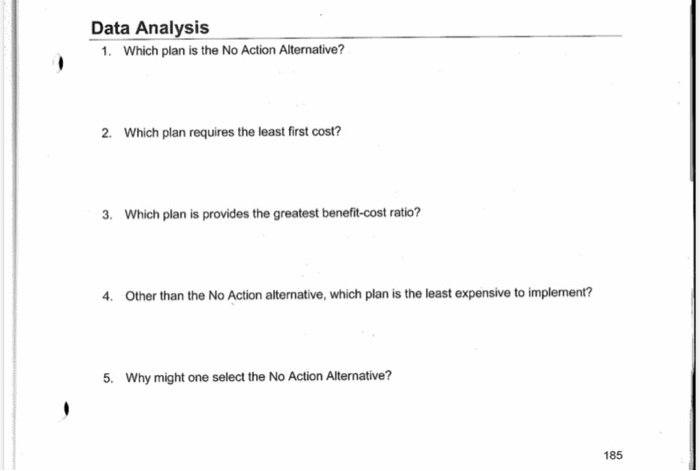
Table 1: Applying and Analyzing Cost-Benefit Analysis Plan Total first Cost" Annual Capital Recovery Cost at Annual O & M Cost *** Total Annual Cost of Project *** Net Cost Savings Average Annual Energy Savings*** ** ** * ** 5%** SO $0 $0 SO $0 $0 $4,000 $10010 $900 $9,110 $10,000 $11,000 $10 $10 $4,400 $11010 $850 $10,160 $4,800 $12,000 $15 $12015 $760 $11,255 $6,000 $15,000 $15 $15015 $650 $14,365 $8,000 $20020 $600 $19,420 $20,000 $25,000 $10,000 $20 $20 $30 $25020 $640 $24,380 $14,000 $35,000 $35030 $900 $34,130 $35 $45035 $1,100 $43,935 $18,000 $25,000 $45,000 $62,500 $40 $62540 $1,400 $61,140 Table 2: Comparison of Benefit-cost Radio to formulate Flood Control project (000 omitted from dollar figures) Plan Annual Project Costs Benefit Cost Ratio* Average Annual Energy Savings (benefits) $0 SO 0 $900 $10,010 0.090 $850 $11,010 0.077 $760 $12,015 0.063 $15,015 0.043 $650 $600 $20,020 0.030 $640 $25,020 0.025 $900 $35,030 0.026 $1,100 $45,035 0.024 $1,400 $62,540 0.022 Data Analysis 1. Which plan is the No Action Alternative? 2. Which plan requires the least first cost? 3. Which plan is provides the greatest benefit-cost ratio? 4. Other than the No Action alternative, which plan is the least expensive to implement? 5. Why might one select the No Action Alternative? 185
Step by Step Solution
There are 3 Steps involved in it

Get step-by-step solutions from verified subject matter experts