

Question: as soon as possible please. this is capsim, official round 4. please answer in numbers. what is the correct performance, size, and reliability. this is
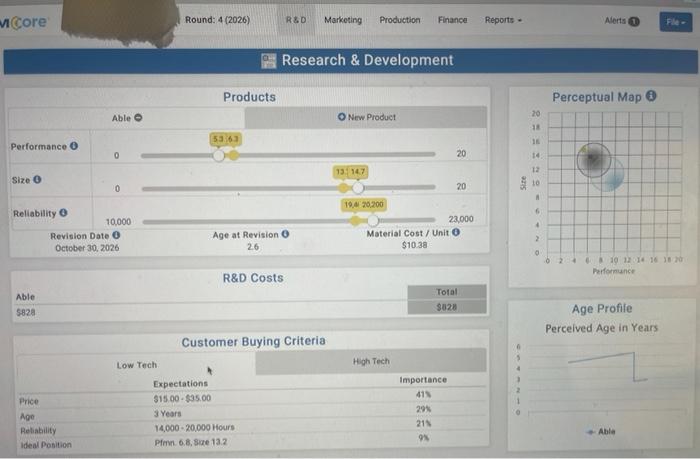
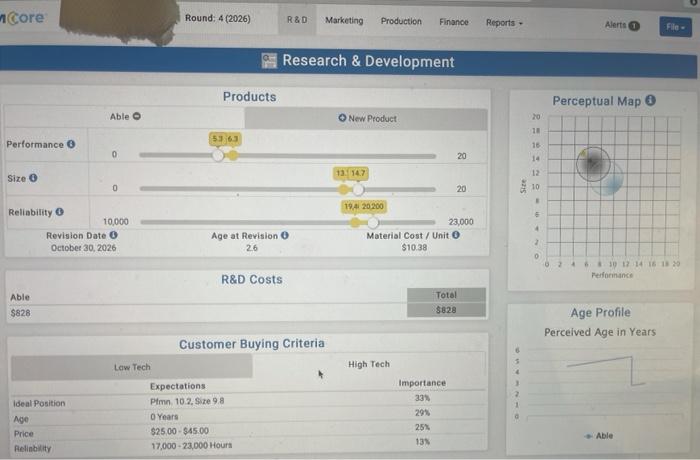
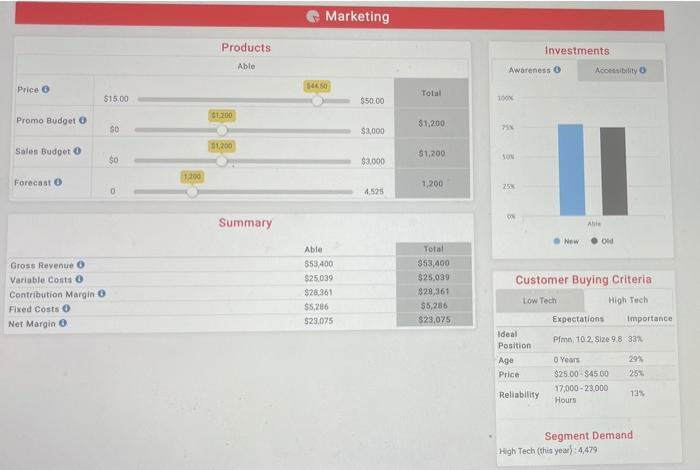
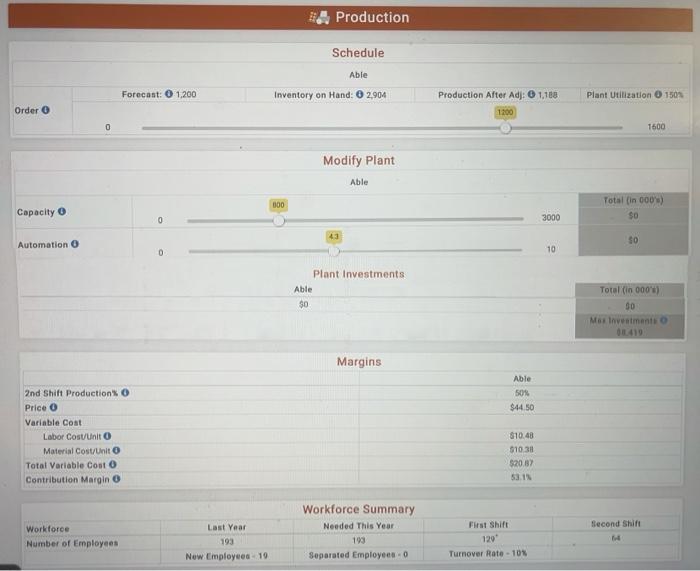
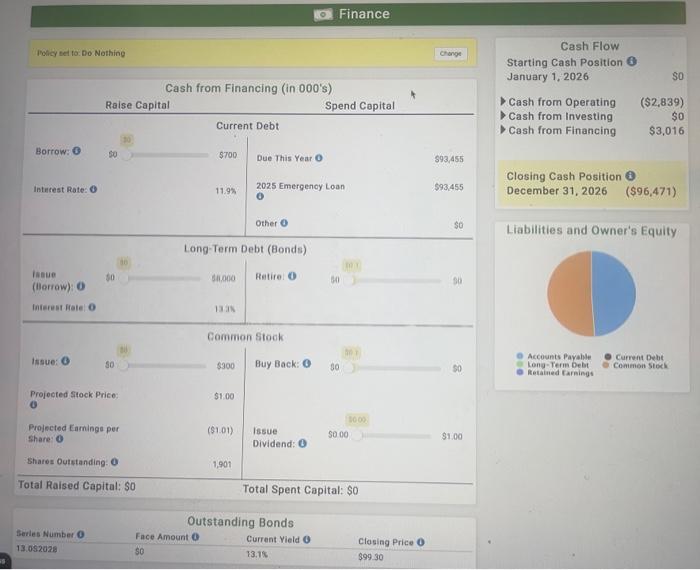
Micore Round: 4 (2026) R&D Marketing Production Finance Reports - Alerts Research & Development Products Perceptual Map Able New Product 20 18 5363 16 Performance 0 20 14 12 13:47 Size o 0 20 10 Site 6 19,420,200 23,000 Material Cost / Unit o $10.38 Reliability 10,000 Revision Date o October 30, 2026 1 Age at Revision 26 2 6 2 10 12 14 16 18 Performance R&D Costs Able 5828 Total $028 Age Profile Perceived Age in Years Customer Buying Criteria Low Tech High Tech Price Age Reliability Ideal Position Expectations $15.00 - $35.00 3 Years 14,000 - 20,000 Hours Pfmn 6.8. Se 13.2 importance 411 295 211 9 Able core Round: 4 (2026) R&D Marketing Production Finance Reports - Alerts File- Research & Development Products Perceptual Map Able New Product 20 10 5363 Performance o 0 20 16 14 13. 14.7 12 Size 6 0 20 10 5 Reliability 10,000 Revision Date o October 30, 2026 19.41 20 200 23,000 Material Cost/Unit $10.38 Age at Revision 26 0 02 4 30 12 14 16 18 20 Performance R&D Costs Able $828 Total $828 Age Profile Perceived Age in Years High Tech Customer Buying Criteria Low Tech Expectations Pimn. 10.2. Size 98 0 Years $25.00 - $45.00 17,000 -23,000 Hours Ideal Position Age Importance 33% 29 25% 13 Price Able Relinbility Marketing Products Investments Able Awareness o Accessibility o Price $450 Total $15.00 100 $50.00 01200 Promo Budget $1.200 SO $2000 PN 11.200 Sales Budget $1,200 $0 $3,000 1:100 Forecast 1,200 25 0 4,525 Summary Aile New OM Gross Revenue o Variable costs Contribution Margin 0 Fixed Costs o Net Margin 0 Able $53.400 $25.039 $28.361 $5,286 $23,075 Total $53,400 $25.039 $28,361 $5,286 $23,075 Customer Buying Criteria Low Tech High Tech Expectations importance Pfm, 10 2. Size 98 33% Ideal Position Age Price 29% 25 0 Years $25.00 $4500 17,000 - 23.000 Hours Reliability 73% Segment Demand High Tech (this year): 4479 1 Production Schedule Able Forecast: 1.200 Inventory on Hand: O2,904 Production Alter Adj: 1,188 Plant Utilization 1501 Order o 1300 0 1600 Modify Plant Able 000 Capacity Total (in 000) $0 3000 43 $0 Automation O 0 10 Plant Investments Able $0 Total (in 000) 30 Mos investments Margins Able 50% $44.50 2nd Shift Production's Price Variable Coat Labor Cost unit o Material Cost/Unito Total Variable Cost Contribution Margin o $10.48 510.38 $20.87 531 Second Shift Workforce Number of Employees Last Year 193 New Employees 19 Workforce Summary Needed This Year 193 Separated Employees 0 First Shift 120 Turnover Rate - 103 O Finance Policy set to Do Nothing Change Cash Flow Starting Cash Position 6 January 1, 2026 SO Cash from Financing (in 000's) Ralse Capital Spend Capital Current Debt Cash from Operating Cash from Investing Cash from Financing ($2,839) $0 $3,016 Borrow: 0 50 $700 Due This Year o 93,455 Interest Rate: 0 2025 Emergency Loan Closing Cash Position December 31, 2026 ($96,471) 11.9% $93.455 Other $0 Liabilities and Owner's Equity Long-Term Debt (Bonds) Issue so 1.000 Retire o 50 SO (torrow): 0 Interest Rate O 13 Common Stock Issue: 0 SO $300 Buy Back: 0 Current Debt Common Stock 30 Accounts Payable Long-Term Debt Retained Earnings 50 Projected Stock Price $1.00 Projected Earnings per Share: ($1.01) Issue Dividend: 1000 SO 00 $1.00 Shares Outstanding: 0 1,901 Total Raised Capital: $0 Total Spent Capital: $0 Series Number o 13.052028 Outstanding Bonds Face Amount Current Yield $0 13.16 Closing Price o $99 30 Micore Round: 4 (2026) R&D Marketing Production Finance Reports - Alerts Research & Development Products Perceptual Map Able New Product 20 18 5363 16 Performance 0 20 14 12 13:47 Size o 0 20 10 Site 6 19,420,200 23,000 Material Cost / Unit o $10.38 Reliability 10,000 Revision Date o October 30, 2026 1 Age at Revision 26 2 6 2 10 12 14 16 18 Performance R&D Costs Able 5828 Total $028 Age Profile Perceived Age in Years Customer Buying Criteria Low Tech High Tech Price Age Reliability Ideal Position Expectations $15.00 - $35.00 3 Years 14,000 - 20,000 Hours Pfmn 6.8. Se 13.2 importance 411 295 211 9 Able core Round: 4 (2026) R&D Marketing Production Finance Reports - Alerts File- Research & Development Products Perceptual Map Able New Product 20 10 5363 Performance o 0 20 16 14 13. 14.7 12 Size 6 0 20 10 5 Reliability 10,000 Revision Date o October 30, 2026 19.41 20 200 23,000 Material Cost/Unit $10.38 Age at Revision 26 0 02 4 30 12 14 16 18 20 Performance R&D Costs Able $828 Total $828 Age Profile Perceived Age in Years High Tech Customer Buying Criteria Low Tech Expectations Pimn. 10.2. Size 98 0 Years $25.00 - $45.00 17,000 -23,000 Hours Ideal Position Age Importance 33% 29 25% 13 Price Able Relinbility Marketing Products Investments Able Awareness o Accessibility o Price $450 Total $15.00 100 $50.00 01200 Promo Budget $1.200 SO $2000 PN 11.200 Sales Budget $1,200 $0 $3,000 1:100 Forecast 1,200 25 0 4,525 Summary Aile New OM Gross Revenue o Variable costs Contribution Margin 0 Fixed Costs o Net Margin 0 Able $53.400 $25.039 $28.361 $5,286 $23,075 Total $53,400 $25.039 $28,361 $5,286 $23,075 Customer Buying Criteria Low Tech High Tech Expectations importance Pfm, 10 2. Size 98 33% Ideal Position Age Price 29% 25 0 Years $25.00 $4500 17,000 - 23.000 Hours Reliability 73% Segment Demand High Tech (this year): 4479 1 Production Schedule Able Forecast: 1.200 Inventory on Hand: O2,904 Production Alter Adj: 1,188 Plant Utilization 1501 Order o 1300 0 1600 Modify Plant Able 000 Capacity Total (in 000) $0 3000 43 $0 Automation O 0 10 Plant Investments Able $0 Total (in 000) 30 Mos investments Margins Able 50% $44.50 2nd Shift Production's Price Variable Coat Labor Cost unit o Material Cost/Unito Total Variable Cost Contribution Margin o $10.48 510.38 $20.87 531 Second Shift Workforce Number of Employees Last Year 193 New Employees 19 Workforce Summary Needed This Year 193 Separated Employees 0 First Shift 120 Turnover Rate - 103 O Finance Policy set to Do Nothing Change Cash Flow Starting Cash Position 6 January 1, 2026 SO Cash from Financing (in 000's) Ralse Capital Spend Capital Current Debt Cash from Operating Cash from Investing Cash from Financing ($2,839) $0 $3,016 Borrow: 0 50 $700 Due This Year o 93,455 Interest Rate: 0 2025 Emergency Loan Closing Cash Position December 31, 2026 ($96,471) 11.9% $93.455 Other $0 Liabilities and Owner's Equity Long-Term Debt (Bonds) Issue so 1.000 Retire o 50 SO (torrow): 0 Interest Rate O 13 Common Stock Issue: 0 SO $300 Buy Back: 0 Current Debt Common Stock 30 Accounts Payable Long-Term Debt Retained Earnings 50 Projected Stock Price $1.00 Projected Earnings per Share: ($1.01) Issue Dividend: 1000 SO 00 $1.00 Shares Outstanding: 0 1,901 Total Raised Capital: $0 Total Spent Capital: $0 Series Number o 13.052028 Outstanding Bonds Face Amount Current Yield $0 13.16 Closing Price o $99 30
Step by Step Solution
There are 3 Steps involved in it

Get step-by-step solutions from verified subject matter experts