

Question: as standards is used on the same for this have diploid AMY 1 copy numbers of 3 , 6 , and 1 4 , respectively.
as standards is used on the same for this have diploid AMY copy numbers of and respectively. The values for the three technical replicates of the known standards are provided.
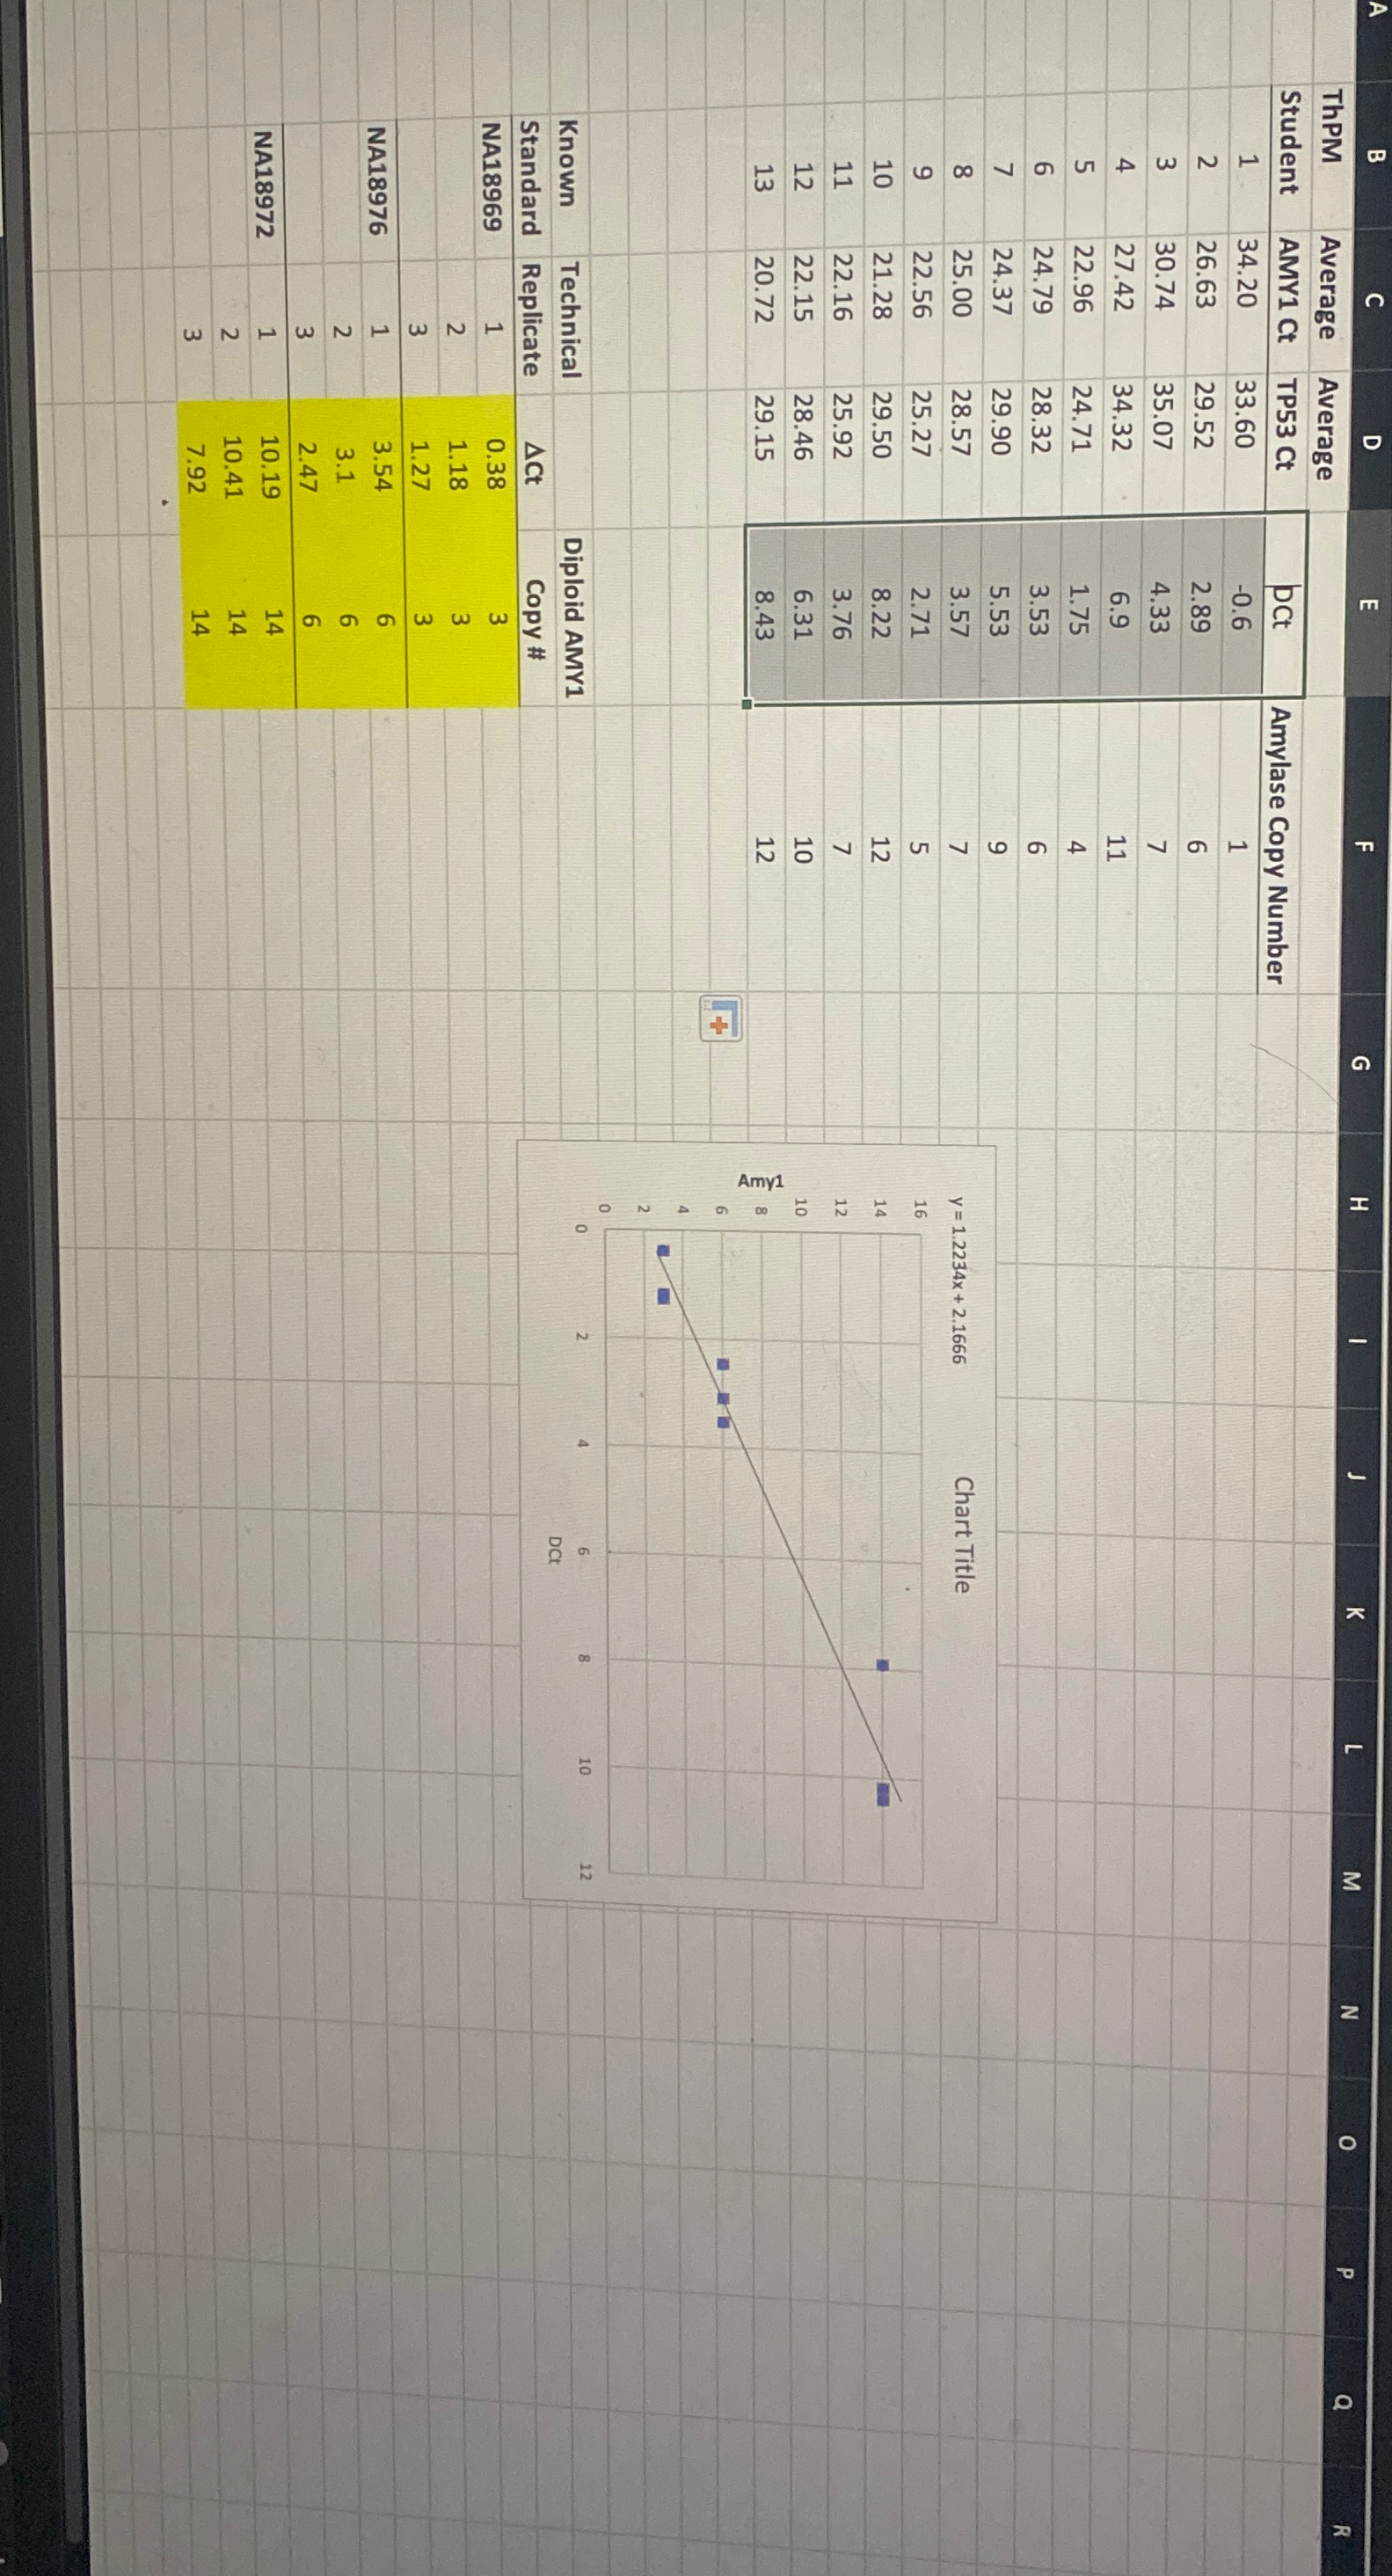
In Excel or Google Sheets select the data highlighted in yellow in the two columns labeled and "Diploid AMY Copy# and use the Scatterplot function InsertChartXY Scatter to determine the relationship between independent variable, axis and AMY copy number dependent variable, axis
Please provide the scatterplot with labeled axes and a Figure caption explaining the plot. Does there appear to be a relationship between and diploid AMY copy number?
Describe the relationship, and explain if this relationship makes sense in light of what you know about how qPCR is sensitive to the initial quantity of template genes present.
In Excel or Google Sheets click on your chart and then select "Add Chart ElementTrendlineLinear". Double click on the trendline and select "Display Equation on chart" and "Display Rsquared value on chart". The equation represents the leastsquares best fit linear regression equation for the relationship between value and diploid AMY copy number. The Rsquared value provides a measure of how well the equation describes the data the closer the value is to or the better the fit
Provide the linear regression equation:
Provide the Rsquare value:
Step by Step Solution
There are 3 Steps involved in it
1 Expert Approved Answer
Step: 1 Unlock

Question Has Been Solved by an Expert!
Get step-by-step solutions from verified subject matter experts
Step: 2 Unlock
Step: 3 Unlock