Question: As the final project for our course, you are expected to evaluate P&G's performance and determine the value of the company. A template is provided.
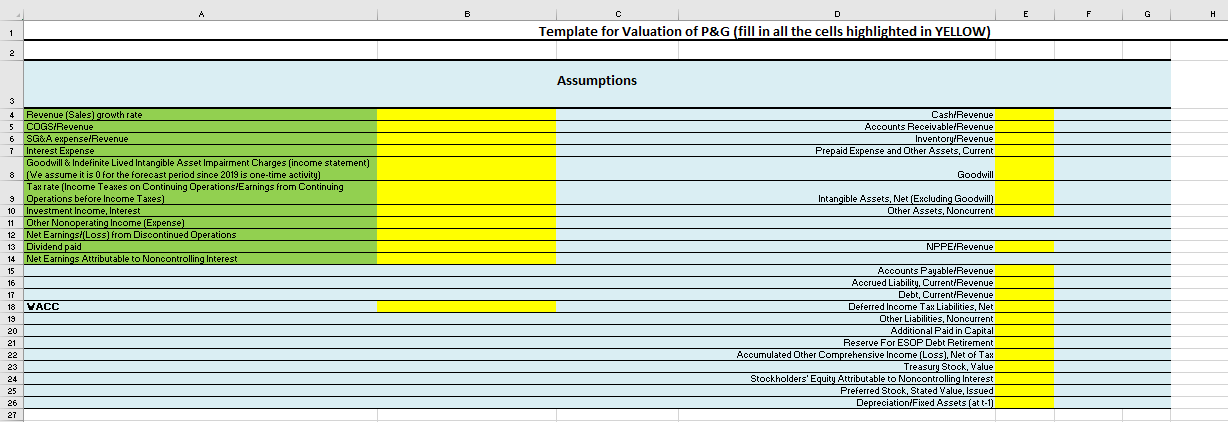
As the final project for our course, you are expected to evaluate P&G's performance and determine the value of the company. A template is provided. Please build your valuation analysis based on the template. The template includes multiple worksheets. The highlighted (in yellow) are the cells you need to fill in.
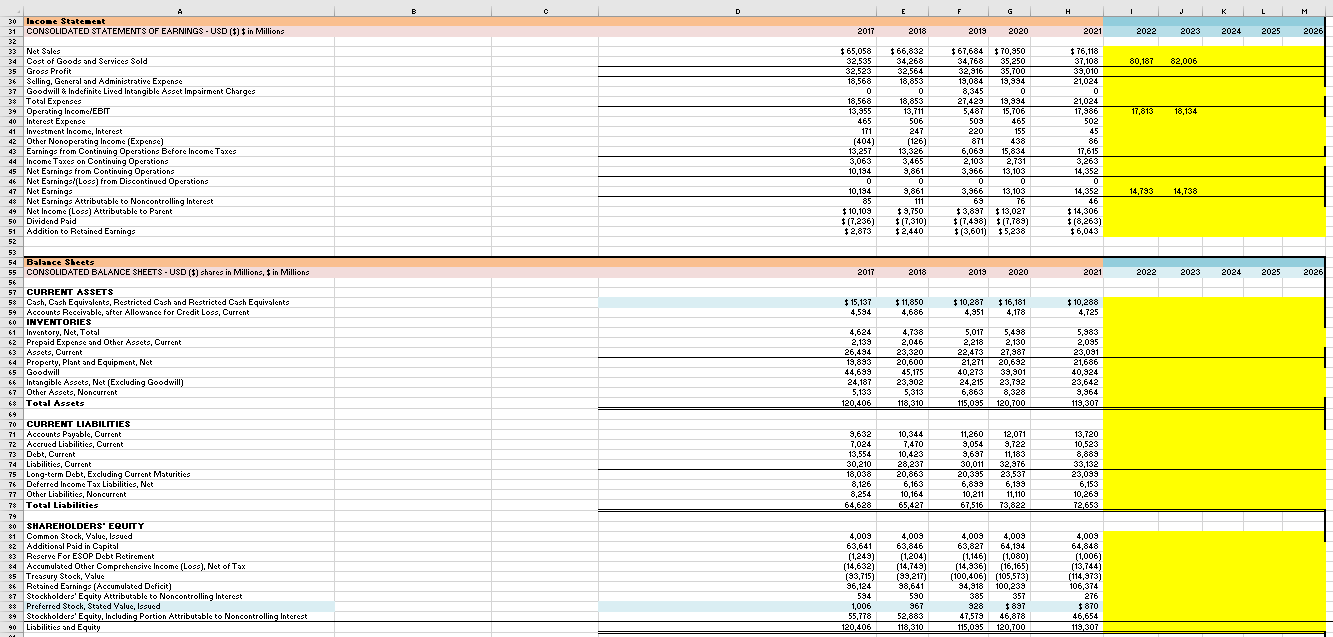
Please note: Since there are some minor errors in PG's 2022 and 2023 financial statements, we use the data up to 2021 in this group case. Please assume the current year is 2021, and we forecast year 2022 and beyond.
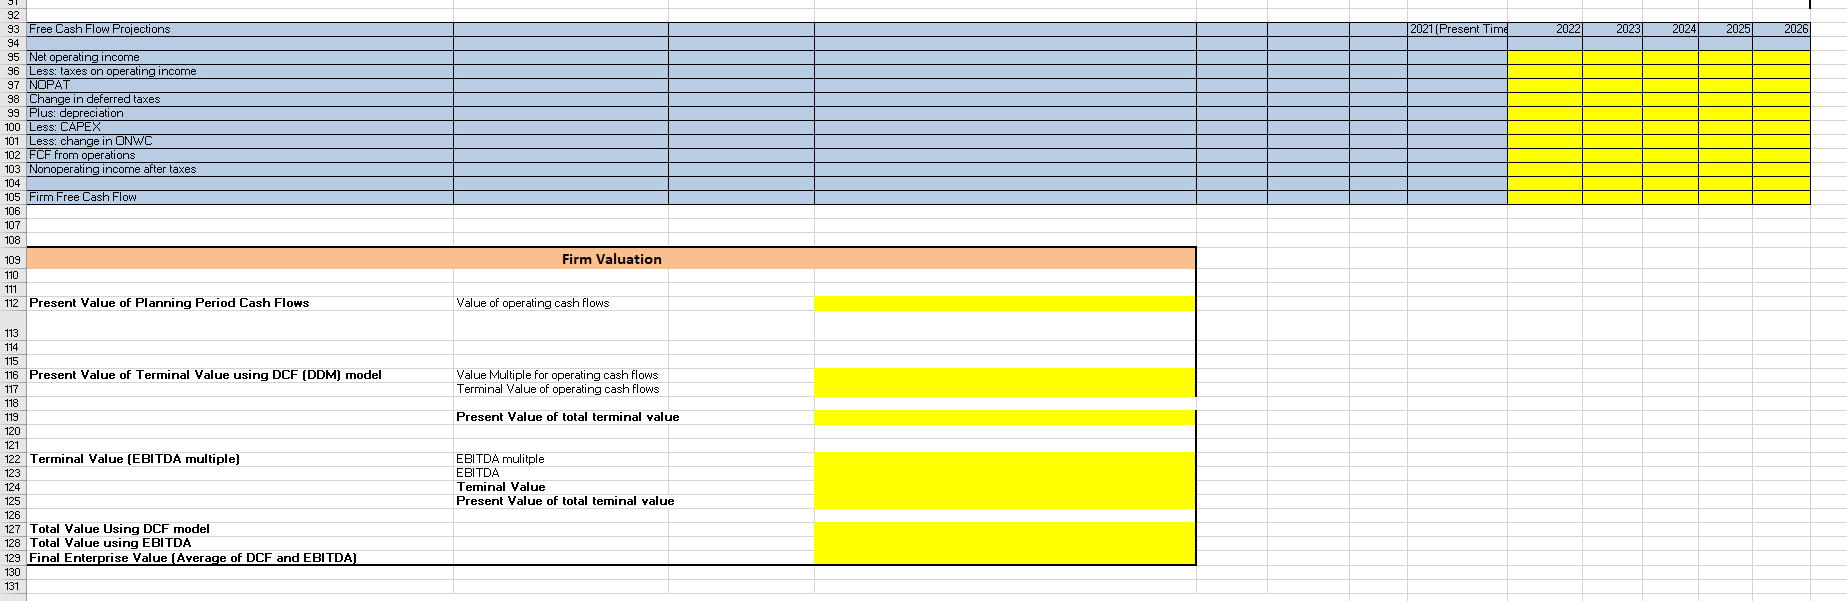
You are expected to apply what you've learned in this course to the best of your ability. Essential components include pro forma analysis (cash flow estimations), risk analysis, discounted cash flow and relative valuation methods, etc. Please note: you are not required to estimate PG's WACC. The WACC (i.e the discount rate) is given as 6.5%.
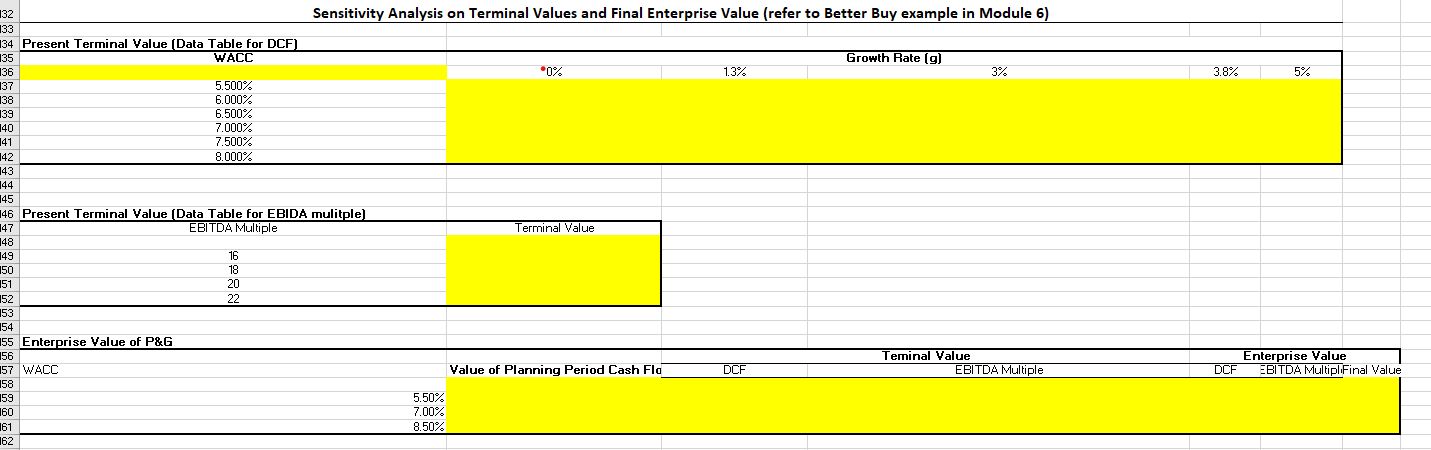
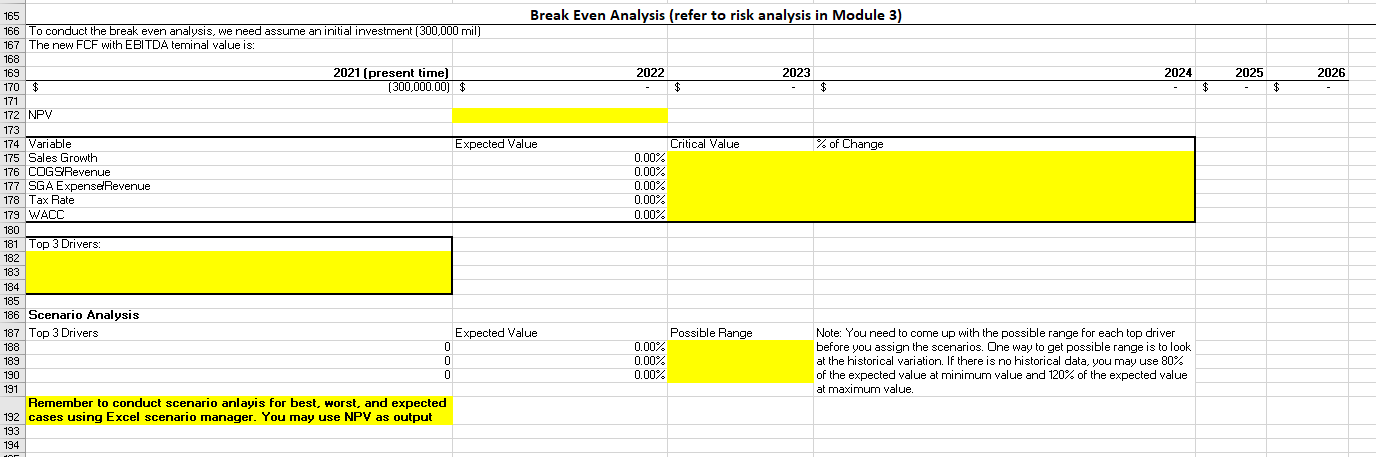
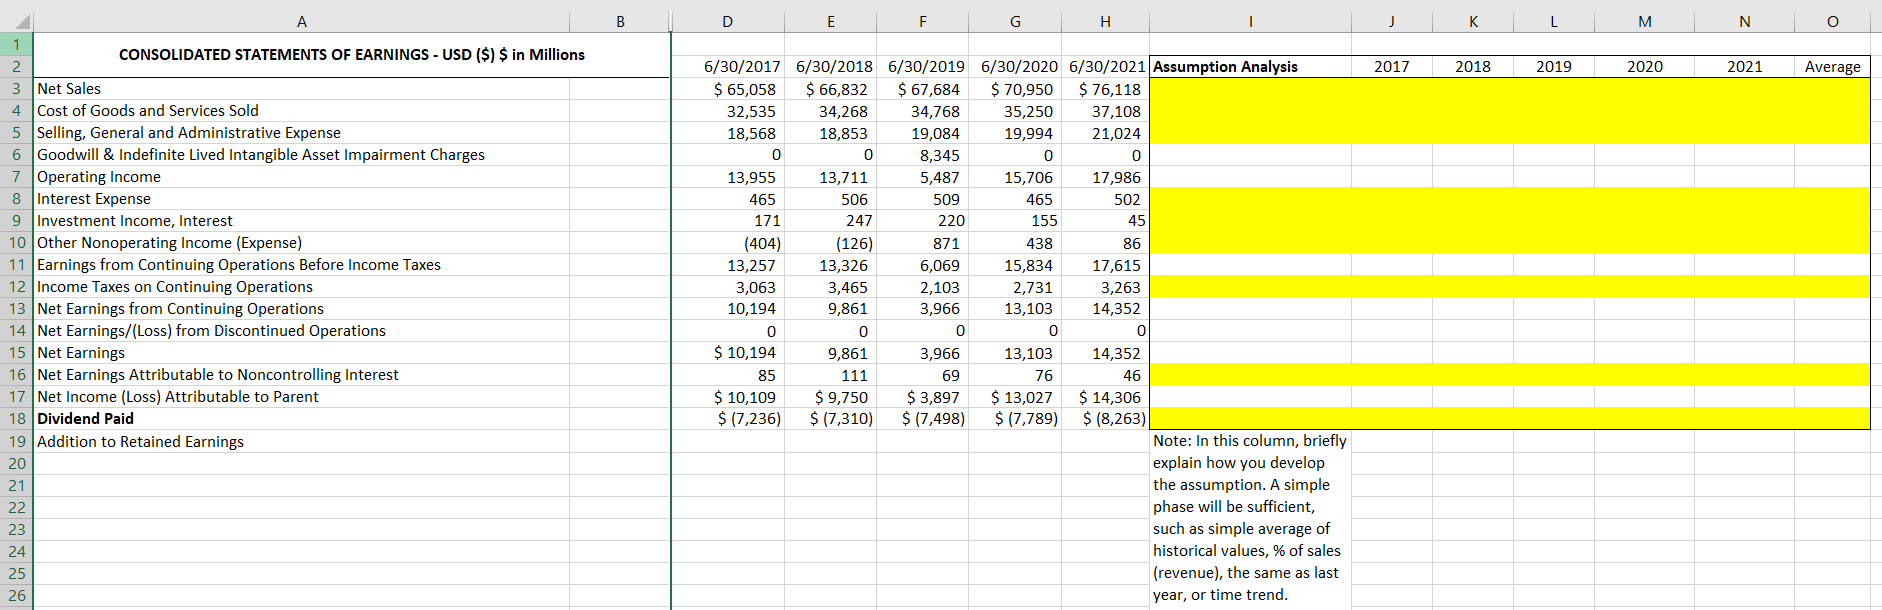
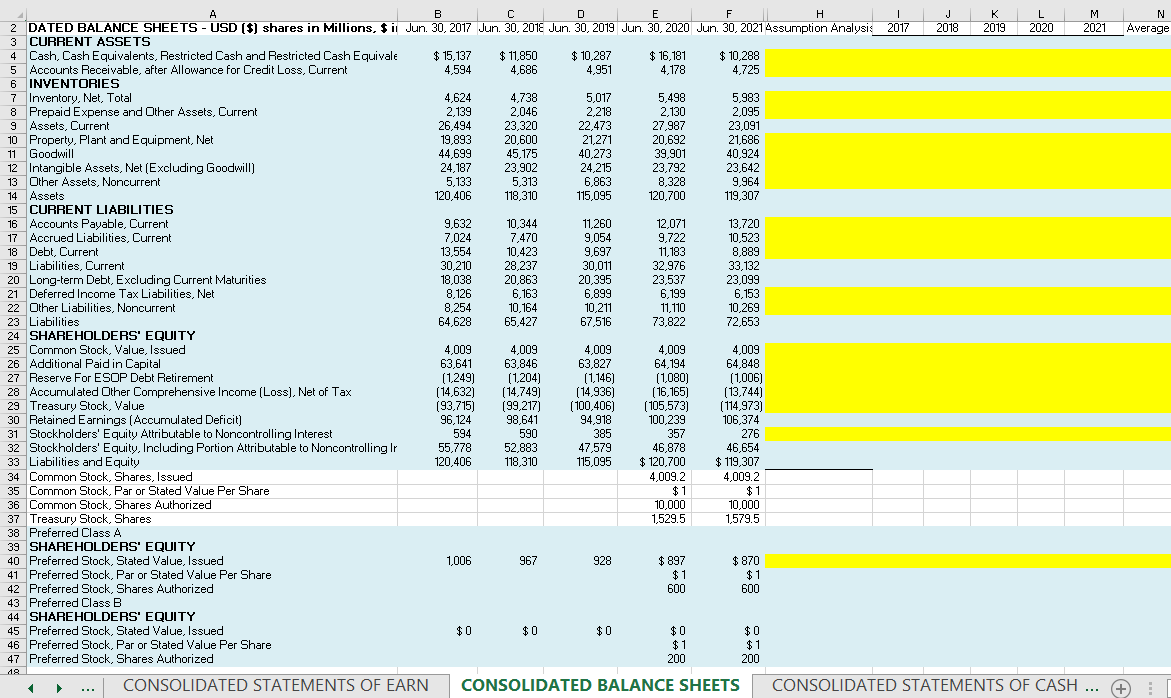
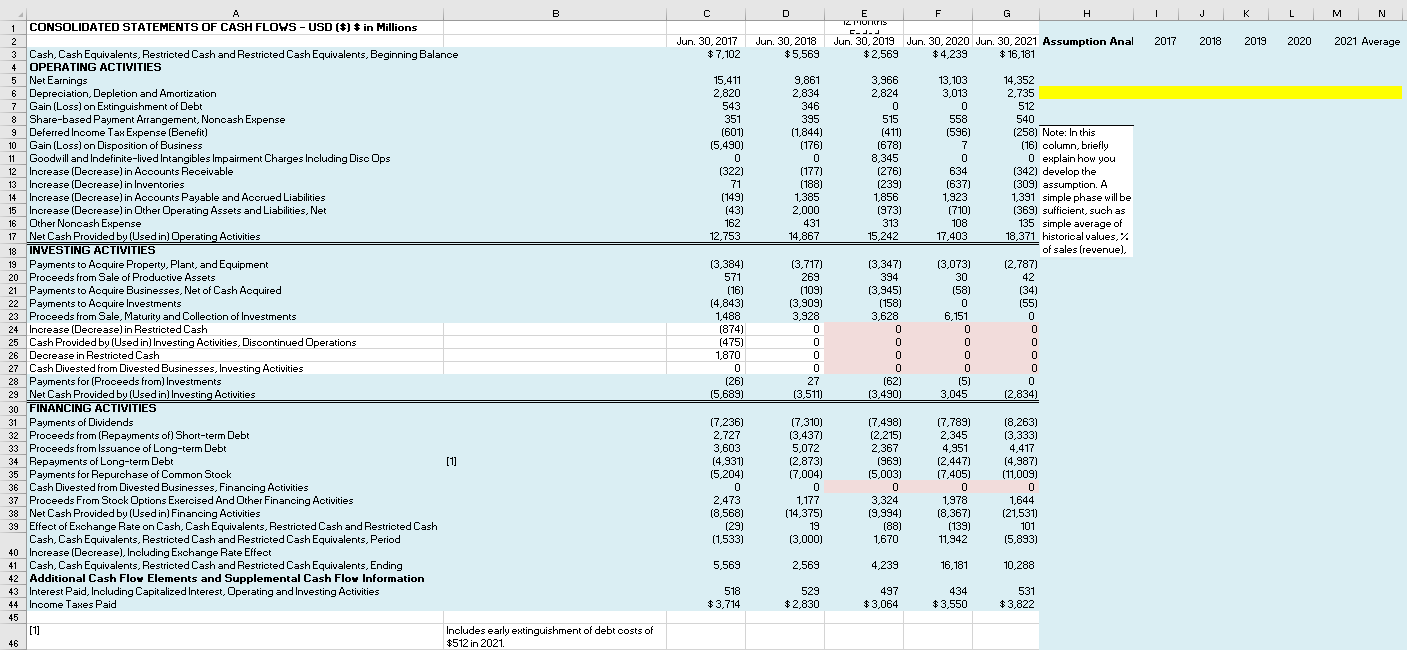
A B C E F G H Template for Valuation of P&G (fill in all the cells highlighted in YELLOW) 2 Assumptions 3 Revenue [Sales] growth rate Cash/Revenue COGS Revenue Accounts ReceivablerRevenue 6 SG&A expenserRevenue Inventory Revenue Interest Expense Prepaid Expense and Other Assets, Current Goodwill & Indefinite Lived Intangible Asset Impairment Charges [income statement) 8 [ We assume it is 0 for the forecast period since 2019 is one-time activity) Goodwill Tax rate [Income Teakes on Continuing Operations Earnings from Continuing Operations before Income Taxes] Intangible Assets, Net [Excluding Goodwill) 10 Investment Income, Interest Other Assets, Noncurrent 11 Other Nonoperating Income [Expense] 12 Net Earnings/[Loss] from Discontinued Operations 13 Dividend paid NPPE/Revenue 14 Net Earnings Attributable to Noncontrolling Interest 15 Accounts Payable Revenue 16 Accrued Liability, Current/Revenue 17 Debt, Current Revenue 18 VACC Deferred Income Tax Liabilities, Net 19 Other Liabilities, Noncurrent 20 Additional Paid in Capital 21 Reserve For ESOP Debt Retirement 22 Accumulated Other Comprehensive Income [Loss), Net of Tax 23 Treasury Stock, Value 24 Stockholders' Equity Attributable to Noncontrolling Interest 25 Preferred Stock, Stated Value, Issued 26 Depreciation Fixed Assets [at t-1)30 Income Statement G H K M 31 CONSOLIDATED STATEMENTS OF EARNINGS - USD ($) $ in Millions 32 2017 2018 2013 2020 2021 2022 2023 2024 2025 2026 33 Net Sales 34 Cost of Goods and Services Sold $ 65,058 $ 66,832 $ 67,684 $ 70,950 $ 76,118 35 Gross Profit 32,53 34,268 34,768 35,250 31,108 80,187 82,006 36 Selling, General and Administrative Expense $2,523 32.56 $2,916 35,700 9,010 37 Goodwill & Indefinite Lived Intangible Asset Impairment Charges 8,568 18.853 19,084 9,994 21,024 Total Expenses 8.345 39 Operating Income/EBIT 8,568 8,853 27,429 9,994 1,024 40 Interest Expense 13.955 13,711 5 18 7 15,706 7,986 17,813 18,134 41 Investment Income, Interest 465 506 509 465 502 42 Other Nonoperating Income [Expense) 171 247 220 155 45 43 Earnings from Continuing Operations Before Income Taxes (404) 126 871 438 86 44 Income Taxes on Continuing Operations 13,257 13,326 6,069 17,615 45 Net Earnings from Continuing Operations 3,06 3,465 2,103 2.731 3,263 46 Net Earnings/[Loss) from Discontinued Operations 10,194 9,861 3,366 13,103 14.352 47 Net Earnings 0 $ Net Earnings Attributable to Noncontrolling Interest 10,194 3,861 3,966 13,103 14.352 14,793 14,738 49 Net Income [Loss) Attributable to Parent 85 11 69 76 46 50 Dividend Paid $ 10,10 $ 9,750 $ 3.897 $ 13,027 $ 14,306 Addition to Retained Earnings $ [7,236) $ [7,310 [7,498) $ (7,789) (8,263) 52 $ 2.873 $ 2,440 $ (3,601) $5,238 $ 6,043 53 54 Balance Sheets 55 CONSOLIDATED BALANCE SHEETS - USD ($) shares in Millions, $ in Millions 56 2017 2018 2019 2020 2021 2022 2023 2024 2025 2026 57 CURRENT ASSETS 53 Cash, Cash Equivalents, Restricted Cash and Restricted Cash Equivalents 59 Accounts Receivable, after Allowance for Credit Loss, Current $ 15,137 $ 11,850 $ 10,287 $ 16,181 $ 10,288 60 INVENTORIES 4,594 4,686 4,951 4,178 4,725 $1 Inventory, Net, Total 62 Prepaid Expense and Other Assets, Current 4,624 4,738 5,017 5,498 5,985 63 Assets, Current ,13 2,046 :,218 2,130 2,095 64 Property, Plant and Equipment, Net 26,494 23,320 12,473 27,987 3,091 65 Goodwill 19.893 20,600 21,271 20,692 21,686 66 Intangible Assets, Net ( Excluding Goodwill) 14,699 45,175 40,273 39,901 40,924 67 Other Assets, Noncurrent 24,187 3,302 24,215 23,792 23,642 6$ Total Assets 5,133 5,313 6,863 8,328 9,96 69 20.406 118,310 15,095 120,700 19,307 70 CURRENT LIABILITIES 71 Accounts Payable, Current 72 Accrued Liabilities, Current 3,632 10.34 11,260 12,071 13,720 73 Debt, Curren 1.024 .470 9,054 9,722 0,523 74 Liabilities, Current 13,554 10,423 9,697 11,183 8,889 75 Long-term Debt, Excluding Current Maturities 30,210 28,231 30,011 32,976 83,132 76 Deferred Income Tax Liabilities, Net 8,038 20,863 20,395 23.537 23.093 77 Other Liabilities, Noncurrent 8,126 6,163 6,899 6,199 6,153 8,254 Total Liabilities 10,164 10,211 11,110 10,269 54,628 65,427 67,516 73,822 2,653 $0 SHAREHOLDERS' EQUITY $1 Common Stock, Value, Issued $2 Additional Paid in Capital 4,009 4,009 4,009 4,009 4,009 $3 Reserve For ESOP Debt Retirement 63,64 53,846 3.827 54,194 54.848 $4 Accumulated Other Comprehensive Income (Loss]. Net of Tax [1,249) [1,204) [1,146) (1,080) 1,006) $5 Treasury Stock, Value 14,632) (14,749) 14,936] [16.165) (13,744) $ Retained Earnings [Accumulated Deficit) 93,715) 93,217) (100,406) (105,573 114,973) $7 Stockholders' Equity Attributable to Noncontrolling Interest 96,124 98,641 94,918 100,239 106,374 $ Preferred Stock, Stated Value, Issued 594 590 385 357 276 $9 Stockholders' Equity, Including Portion Attributable to Noncontrolling Interest 1,006 967 328 $ 897 $ 870 90 Liabilities and Equity $5,778 $2.883 47,579 46,87 46,654 120,406 118,310 15,095 120,700 19,30792 93 Free Cash Flow Projections 2021 [Present Time 2022 2023 2024 2025 2026 94 95 Net operating income 96 Less: taxes on operating income 97 NOPAT 98 Change in deferred taxes 99 Plus: depreciation 100 Less: CAPEX 101 Less: change in ONWC 102 FCF from operations 103 Nonoperating income after taxes 104 105 Firm Free Cash Flow 106 107 108 109 Firm Valuation 110 111 112 Present Value of Planning Period Cash Flows Value of operating cash flows 113 114 115 116 Present Value of Terminal Value using DCF (DDM) model Value Multiple for operating cash flows 117 Terminal Value of operating cash flows 118 119 Present Value of total terminal value 120 122 Terminal Value [EBITDA multiple] EBITDA mulitple 123 EBITDA 124 Teminal Value 125 Present Value of total teminal value 126 127 Total Value Using DCF model 128 Total Value using EBITDA 129 Final Enterprise Value [Average of DCF and EBITDA] 130 131Sensitivity Analysis on Terminal Values and Final Enterprise Value (refer to Better Buy example in Module 6) 32 133 Present Terminal Value [Data Table for DCF) Growth Rate (9] 35 WACC 0% 1.3% 3% 3.8% 5% 36 137 5.500% 138 6.000% 139 6.500% 140 7.000% 141 7.500% 42 8.000% 43 44 45 46 Present Terminal Value [Data Table for EBIDA mulitple] EBITDA Multiple Terminal Value 47 148 49 16 50 18 151 20 52 22 53 54 55 Enterprise Value of P&G Teminal Value Enterprise Value 56 EBITDA Multiple DCF EBITDA MultipliFinal Value WACC Value of Planning Period Cash Flo DCF 58 59 5.50% 160 7.00% 8.50% 61 162165 Break Even Analysis (refer to risk analysis in Module 3) 166 To conduct the break even analysis, we need assume an initial investment [300,000 mil) 167 The new FCF with EBITDA teminal value is: 168 169 2021 (present time] 2022 2023 2024 2025 2026 170 $ (300,000.00) $ $ $ $ $ 171 172 NPV 173 174 Variable Expected Value Critical Value % of Change 175 Sales Growth 0.00% 176 COGS/Revenue 0.00% 177 SGA Expense/Revenue 0.00% 178 Tax Rate 0.00% 179 WACC 0.00% 180 181 Top 3 Drivers: 182 183 184 185 186 Scenario Analysis 187 Top 3 Drivers Expected Value Possible Range Note: You need to come up with the possible range for each top driver 188 0.00% before you assign the scenarios. One way to get possible range is to look 189 0.00% at the historical variation. If there is no historical data, you may use 80% 190 0.00%% of the expected value at minimum value and 120% of the expected value 191 at maximum value. Remember to conduct scenario anlayis for best, worst, and expected 192 cases using Excel scenario manager. You may use NPV as output 193 94NN A W N 1 12 13 14 15 16 17 18 19 20 21 22 23 24 25 26 A CONSOLIDATED STATEMENTS OF EARNINGS - USD ($) $ in Millions Net Sales Cost of Goods and Services Sold Selling, General and Administrative Expense Goodwill & Indefinite Lived Intangible Asset Impairment Charges Operating Income Interest Expense Investment Income, Interest Other Nonoperating Income (Expense) Earnings from Continuing Operations Before Income Taxes Income Taxes on Continuing Operations Net Earnings from Continuing Operations Net Earnings/(Loss) fram Discontinued Operations Net Earnings Net Earnings Attributable to Noncontrolling Interest Net Income (Loss) Attributable to Parent Dividend Paid Addition to Retained Earnings D 6/30/2017 $ 65,058 32,535 18,568 0 13,955 465 171 (404) 13,257 3,063 10,194 0 $10,194 85 $10,109 $(7.236) G H 6/30/2018 6/30/2019 6/30/2020 6/30/2021 $ 66,832 34,268 18,853 0 13,711 506 247 (126) 13,326 3.465 9,861 0 9,861 111 $9,750 $(7.310) $67,684 34,768 19,084 8,345 5,487 509 220 871 6,069 2,103 3,966 0 3,966 69 $3,897 $(7.498) $70,950 35,250 19,994 0 15,706 465 155 438 15,834 2,731 13,103 0 13,103 76 $13,027 $(7,789) $76,118 37,108 21,024 0 17,986 502 45 86 17,615 3,263 14,352 0 14,352 46 $ 14,306 $(8,263) M N o Assumption Analysis 2017 2018 2019 2020 2021 Average Note: In this column, briefly explain how you develop the assumption. A simple phase will be sufficient, such as simple average of historical values, % of sales (revenue), the same as last year, or time trend. A B C D E F H J K L M N DATED BALANCE SHEETS - USD ($) shares in Millions, $ it Jun. 30, 2017 Jun. 30, 2018 Jun. 30, 2019 Jun. 30, 2020 Jun. 30, 2021 Assumption Analysis 2017 2018 2019 2020 2021 Average CURRENT ASSETS Cash, Cash Equivalents, Restricted Cash and Restricted Cash Equivale $ 15.137 $ 11,850 $ 10,287 $ 16,181 $ 10,288 Accounts Receivable. after Allowance for Credit Loss, Current 4,594 4.686 4,951 4,178 4,725 6 INVENTORIES Inventory, Net, Total 4,624 4,738 5,017 5,498 5,983 8 Prepaid Expense and Other Assets, Current 2,139 2,046 2,218 2,130 2,095 Assets, Current 26,494 23,320 22.473 27,987 23,091 10 Property, Plant and Equipment, Net 19.893 20,600 21,271 20.692 21,686 1 Goodwill 44,699 45.175 40,273 39,901 40.924 12 Intangible Assets, Net (Excluding Goodwill) 24.187 23.902 24.215 23,792 23.642 13 Other Assets, Noncurrent 5.133 5.313 6,863 8,328 9.964 14 Assets 120,406 118.310 115,095 120,700 119,307 15 CURRENT LIABILITIES 6 Accounts Payable, Current 9,632 10,344 11,260 12,071 13.720 17 Accrued Liabilities, Current 7,024 7,470 9,054 9,722 10,523 18 Debt, Current 13,554 10,423 9,697 11,183 8,889 19 Liabilities, Current 30,210 28.237 30.071 32,976 33,132 20 Long-term Debt, Excluding Current Maturities 18,038 20.863 20,395 23,537 23,099 21 Deferred Income Tax Liabilities, Net 8.126 6.163 6,899 6,199 6,153 22 Other Liabilities, Noncurrent 8,254 10,164 10,211 11,110 10,269 23 Liabilities 64,628 65,427 67,516 73,822 72.653 24 SHAREHOLDERS' EQUITY 25 Common Stock, Value, Issued 4,009 4,009 4,009 4,009 4.009 26 Additional Paid in Capital 63.641 63.846 63,827 64.194 64.848 27 Reserve For ESOP Debt Retirement [1.249) [1,204) 1,146 (1,080) [1,006) 28 Accumulated Other Comprehensive Income (Loss]. Net of Tax (14.632) [14.749) (14,936) [16.165) [13,744) 29 Treasury Stock, Value [93.715) [99,217) [100,406) (105,573] [114,973) 30 Retained Earnings [ Accumulated Deficit) 96,124 98,641 94,918 100,239 106,374 31 Stockholders' Equity Attributable to Noncontrolling Interest 594 590 385 357 276 32 Stockholders' Equity, Including Portion Attributable to Noncontrolling Ir 55,778 52,883 47.579 46.878 46,654 33 Liabilities and Equity 120,406 118.310 115,095 $ 120,700 $ 119,307 34 Common Stock, Shares, Issued 4,009.2 4,009.2 35 Common Stock, Par or Stated Value Per Share $1 $1 36 Common Stock, Shares Authorized 10,000 10,000 37 Treasury Stock, Shares 1,529.5 1,579.5 36 Preferred Class A 39 SHAREHOLDERS' EQUITY 40 Preferred Stock, Stated Value, Issued 1,006 967 928 $ 897 $ 870 41 Preferred Stock, Par or Stated Value Per Share $1 $1 42 Preferred Stock, Shares Authorized 600 600 43 Preferred Class B 44 SHAREHOLDERS' EQUITY 45 Preferred Stock, Stated Value, Issued $0 $0 $0 $0 $0 46 Preferred Stock, Par or Stated Value Per Share $1 $1 47 Preferred Stock. Shares Authorized 200 200 . . . CONSOLIDATED STATEMENTS OF EARN CONSOLIDATED BALANCE SHEETS CONSOLIDATED STATEMENTS OF CASH ... (+A B C E F G H J K L M N CONSOLIDATED STATEMENTS OF CASH FLOWS - USD ($) $ in Millions Jun. 30, 2017 Jun. 30, 2018 Jun. 30, 2019 Jun. 30, 2020 Jun. 30, 2021 Assumption Anal 2017 2018 2019 2020 2021 Average Cash, Cash Equivalents, Restricted Cash and Restricted Cash Equivalents, Beginning Balance $ 7.102 $ 5,569 $2,569 $ 4,239 $ 16,181 OPERATING ACTIVITIES Net Earnings 15,411 9,861 3,966 13,103 14.352 Depreciation, Depletion and Amortization 2.820 2.834 2,824 3.013 2,735 Gain (Loss] on Extinguishment of Debt 543 346 512 Share-based Payment Arrangement, Noncash Expense 351 395 515 558 540 Deferred Income Tax Expense (Benefit) 1601 (1,844) (411) (596) (258) Note: In this 10 Gain (Loss) on Disposition of Business (5,490) (176) (678) (16) column, briefly 11 Goodwill and Indefinite-lived Intangibles Impairment Charges Including Disc Ops 0 8.345 0 0 explain how you 12 Increase (Decrease) in Accounts Receivable 322 (177) (276) 534 (342) develop the 13 Increase (Decrease) in Inventories 71 (188) (239) (637 (309) assumption. A 14 Increase (Decrease) in Accounts Payable and Accrued Liabilities (149 1,385 1,856 1,923 1,391 simple phase will be 15 Increase (Decrease) in Other Operating Assets and Liabilities, Net (43) 2,000 (973) (710) 369) sufficient, such as 16 Other Noncash Expense 162 431 313 108 135 simple average of 17 Net Cash Provided by (Used in) Operating Activities 12,753 14.867 15,242 17.403 18.371 historical values, % 18 INVESTING ACTIVITIES of sales (revenue), 19 Payments to Acquire Property, Plant, and Equipment (3,384) (3,717) (3,347) (3,073) (2.787) 20 Proceeds from Sale of Productive Assets 571 269 394 30 42 21 Payments to Acquire Businesses, Net of Cash Acquired [16) (109) (3.945) (58) (34) 22 Payments to Acquire Investments (4.843) (3.9091 (158) 0 (55) 23 Proceeds from Sale, Maturity and Collection of Investments 1,488 3,928 3,628 6,151 0 24 Increase (Decrease) in Restricted Cash (874) 0 0 0 25 Cash Provided by (Used in) Investing Activities, Discontinued Operations (475 0 0 26 Decrease in Restricted Cash 1870 0 0 0 0 27 Cash Divested from Divested Businesses, Investing Activities 0 28 Payments for (Proceeds from] Investments 26) 27 (621 (5) 29 Net Cash Provided by (Used in) Investing Activities 5,689 (3,511 3.045 (2.834) 30 FINANCING ACTIVITIES 31 Payments of Dividends (7.236 (7,310) (7,498) (7.789) 8,263) 32 Proceeds from (Repayments of) Short-term Debt 2,727 (3,437) (2,215) 2.345 (3,333) 33 Proceeds from Issuance of Long-term Deb 3,603 5,072 2,367 4,951 4,417 34 Repayments of Long-term Debt [1] (4,931) (2.873) (969) (2.447) (4,987) 35 Payments for Repurchase of Common Stock (5,204) (7 004) (5,003) (7,405) (11,009) 36 Cash Divested from Divested Businesses, Financing Activities 0 0 37 Proceeds From Stock Options Exercised And Other Financing Activities 2.473 1,177 3,324 1,978 1,644 38 Net Cash Provided by (Used in) Financing Activities (8,568) (14.375) (9,994) 8,367) (21,531) 39 Effect of Exchange Rate on Cash, Cash Equivalents, Restricted Cash and Restricted Cash (29) 19 (88) (139) 101 Cash, Cash Equivalents, Restricted Cash and Restricted Cash Equivalents, Period (1,533) (3,000) 1,670 11,942 5.893) 40 Increase (Decrease), Including Exchange Rate Effect 41 Cash, Cash Equivalents, Restricted Cash and Restricted Cash Equivalents, Ending 5,569 2,569 4,239 16,181 10,288 42 Additional Cash Flow Elements and Supplemental Cash Flow Information 43 Interest Paid, Including Capitalized Interest, Operating and Investing Activities 518 529 497 434 531 44 Income Taxes Paid $ 3,714 $ 2,830 $ 3,064 $ 3,550 $ 3,822 45 [1] Includes early extinguishment of debt costs of 46 $512 in 2021
Step by Step Solution
There are 3 Steps involved in it
1 Expert Approved Answer
Step: 1 Unlock
Question Has Been Solved by an Expert!
Get step-by-step solutions from verified subject matter experts
Step: 2 Unlock
Step: 3 Unlock
Students Have Also Explored These Related Finance Questions!