

Question: As the instructions state, please use MATLAB. for each step: when generating the random variables: use MATLAB. when plotting the histogram and scatter plot: use
As the instructions state, please use MATLAB. for each step: when generating the random variables: use MATLAB. when plotting the histogram and scatter plot: use MATLAB.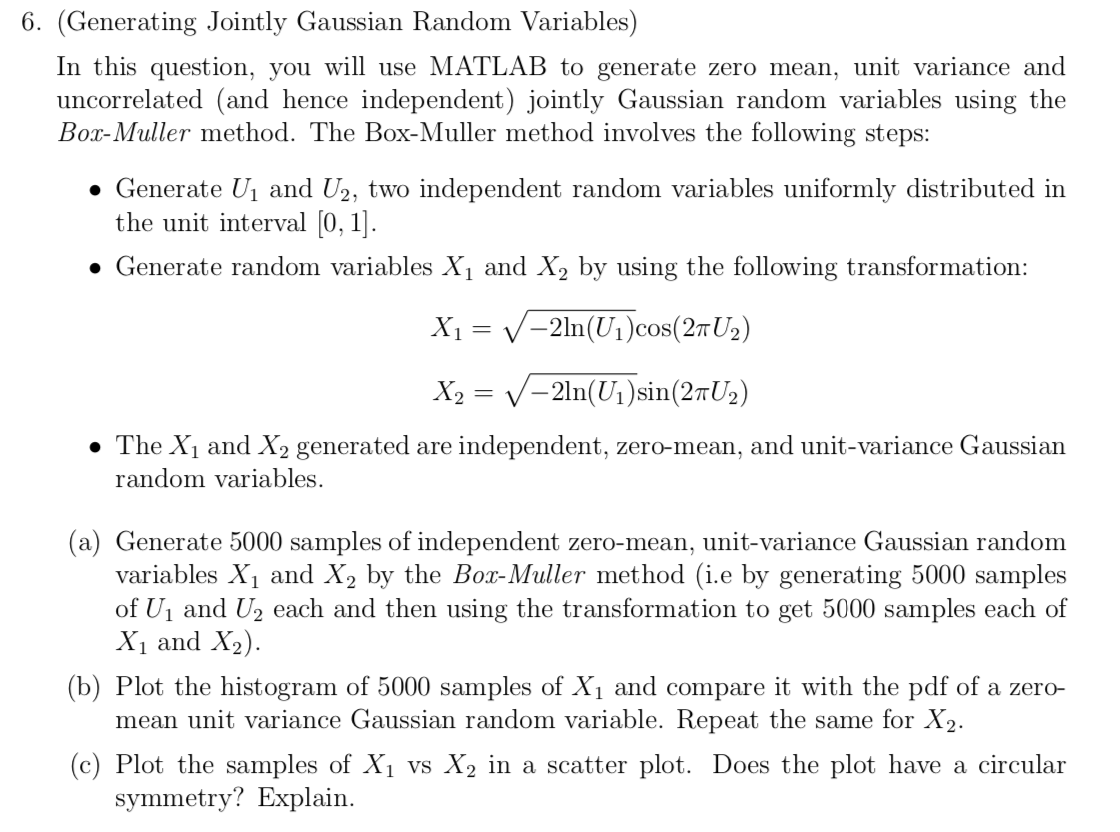
6. (Generating Jointly Gaussian Random Variables) In this question, you will use MATLAB to generate zero mean, unit variance and uncorrelated (and hence independent) jointly Gaussian random variables using the Box-Muller method. The Box-Muller method involves the following steps: Generate U and U2, two independent random variables uniformly distributed in the unit interval [0, 1]. Generate random variables X1 and X2 by using the following transformation: X1 = V2ln(U1)cos(21U2) X2 = -2ln(Ul)sin(21U2) The X and X2 generated are independent, zero-mean, and unit-variance Gaussian random variables. (a) Generate 5000 samples of independent zero-mean, unit-variance Gaussian random variables X1 and X2 by the Box-Muller method (i.e by generating 5000 samples of U and U2 each and then using the transformation to get 5000 samples each of X and X2). (b) Plot the histogram of 5000 samples of X and compare it with the pdf of a zero- mean unit variance Gaussian random variable. Repeat the same for X2. (c) Plot the samples of X vs X2 in a scatter plot. Does the plot have a circular symmetry? Explain. 6. (Generating Jointly Gaussian Random Variables) In this question, you will use MATLAB to generate zero mean, unit variance and uncorrelated (and hence independent) jointly Gaussian random variables using the Box-Muller method. The Box-Muller method involves the following steps: Generate U and U2, two independent random variables uniformly distributed in the unit interval [0, 1]. Generate random variables X1 and X2 by using the following transformation: X1 = V2ln(U1)cos(21U2) X2 = -2ln(Ul)sin(21U2) The X and X2 generated are independent, zero-mean, and unit-variance Gaussian random variables. (a) Generate 5000 samples of independent zero-mean, unit-variance Gaussian random variables X1 and X2 by the Box-Muller method (i.e by generating 5000 samples of U and U2 each and then using the transformation to get 5000 samples each of X and X2). (b) Plot the histogram of 5000 samples of X and compare it with the pdf of a zero- mean unit variance Gaussian random variable. Repeat the same for X2. (c) Plot the samples of X vs X2 in a scatter plot. Does the plot have a circular symmetry? Explain
Step by Step Solution
There are 3 Steps involved in it

Get step-by-step solutions from verified subject matter experts