

Question: As the operations manager for a high-end perfumer, you are looking to hire a junior operations analyst for the quality control department. Four candidates were
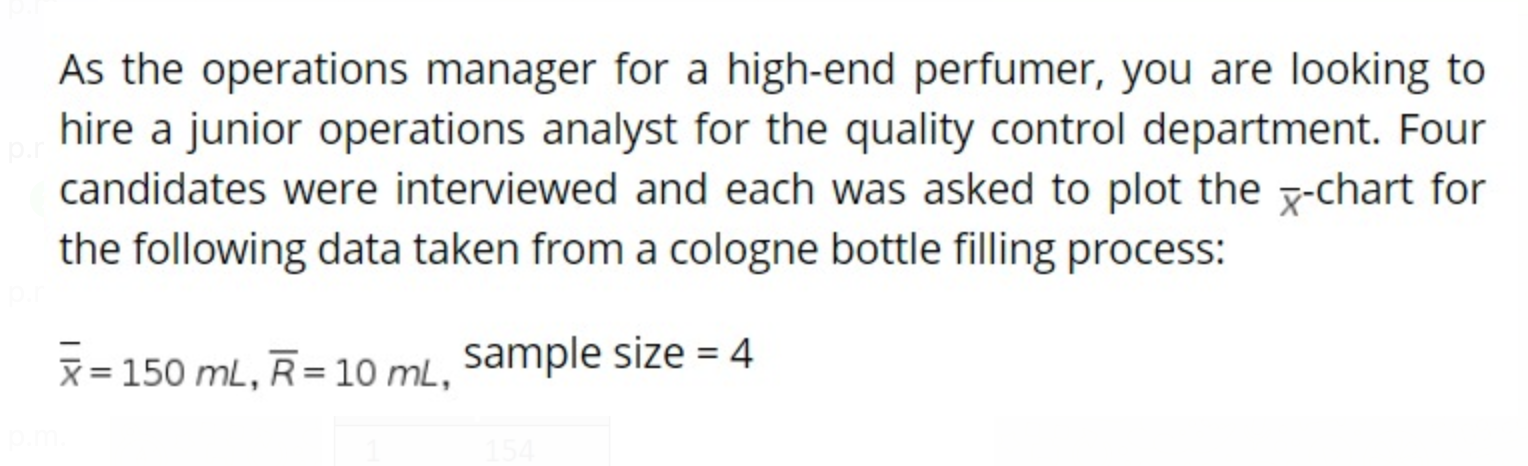
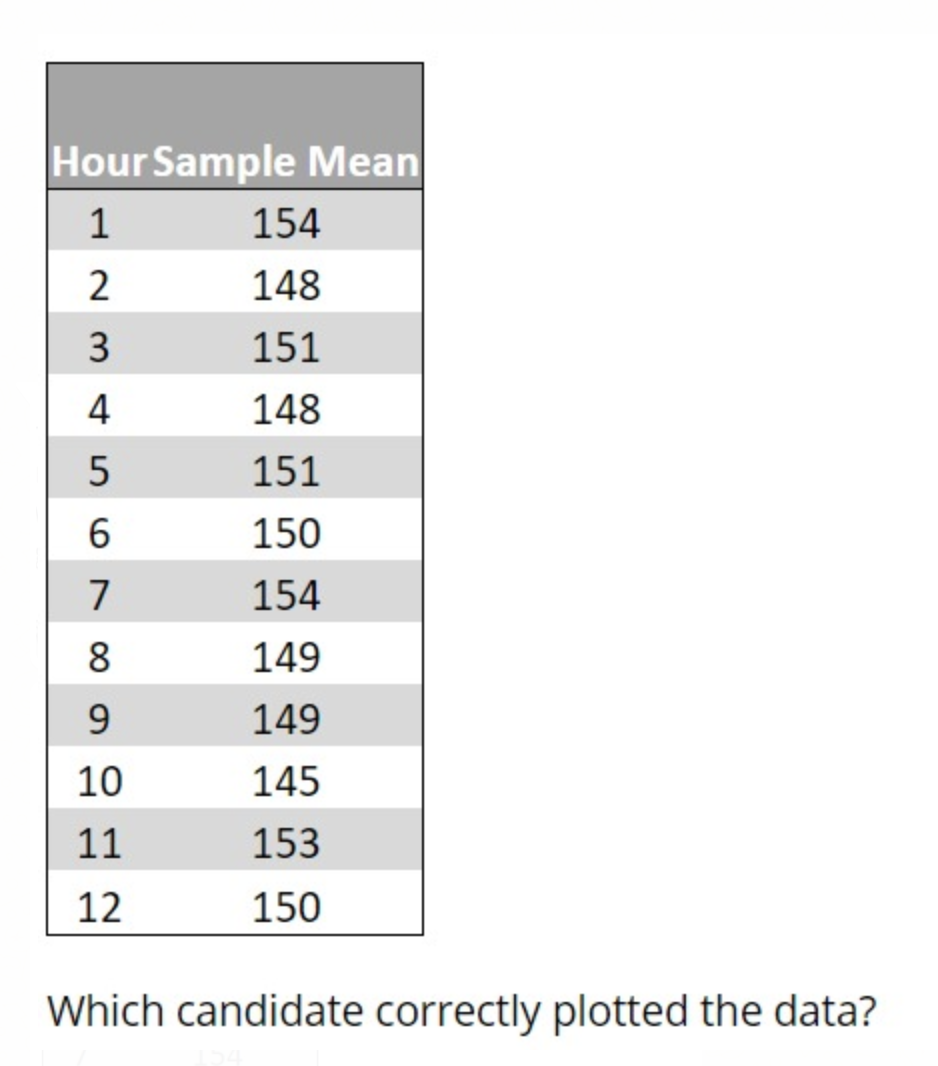
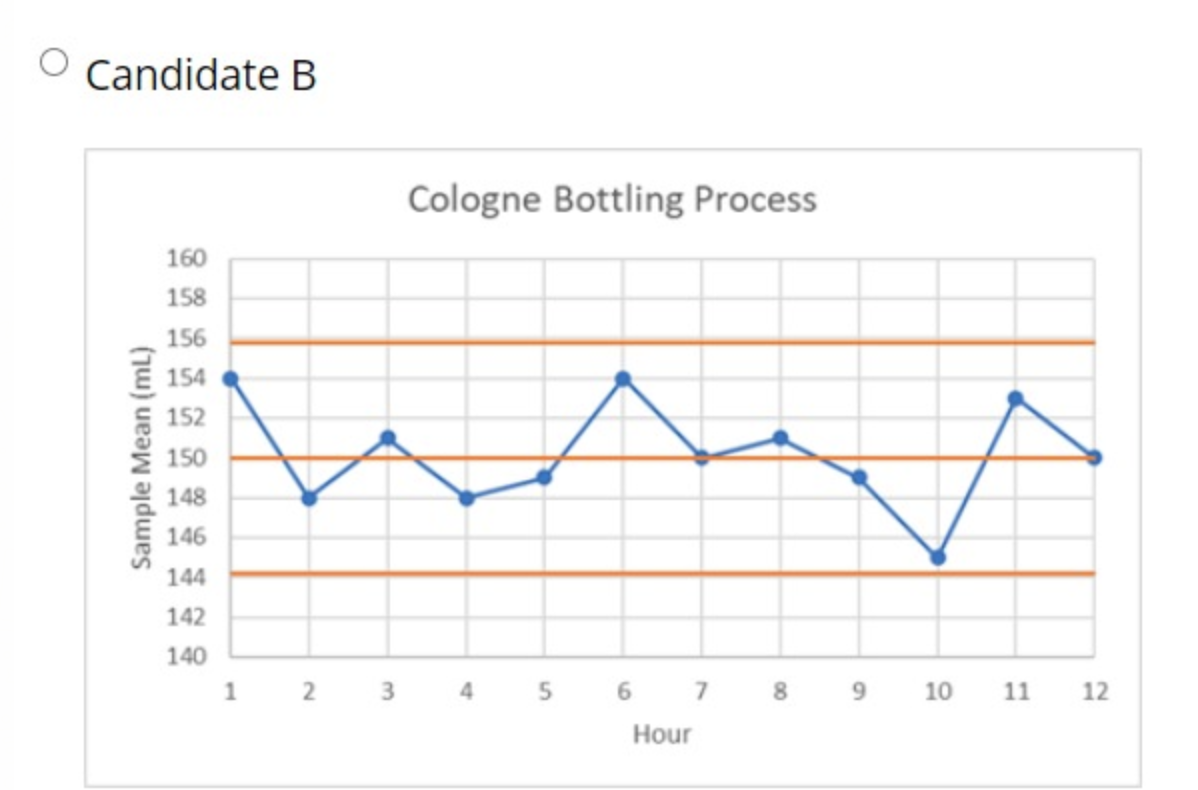
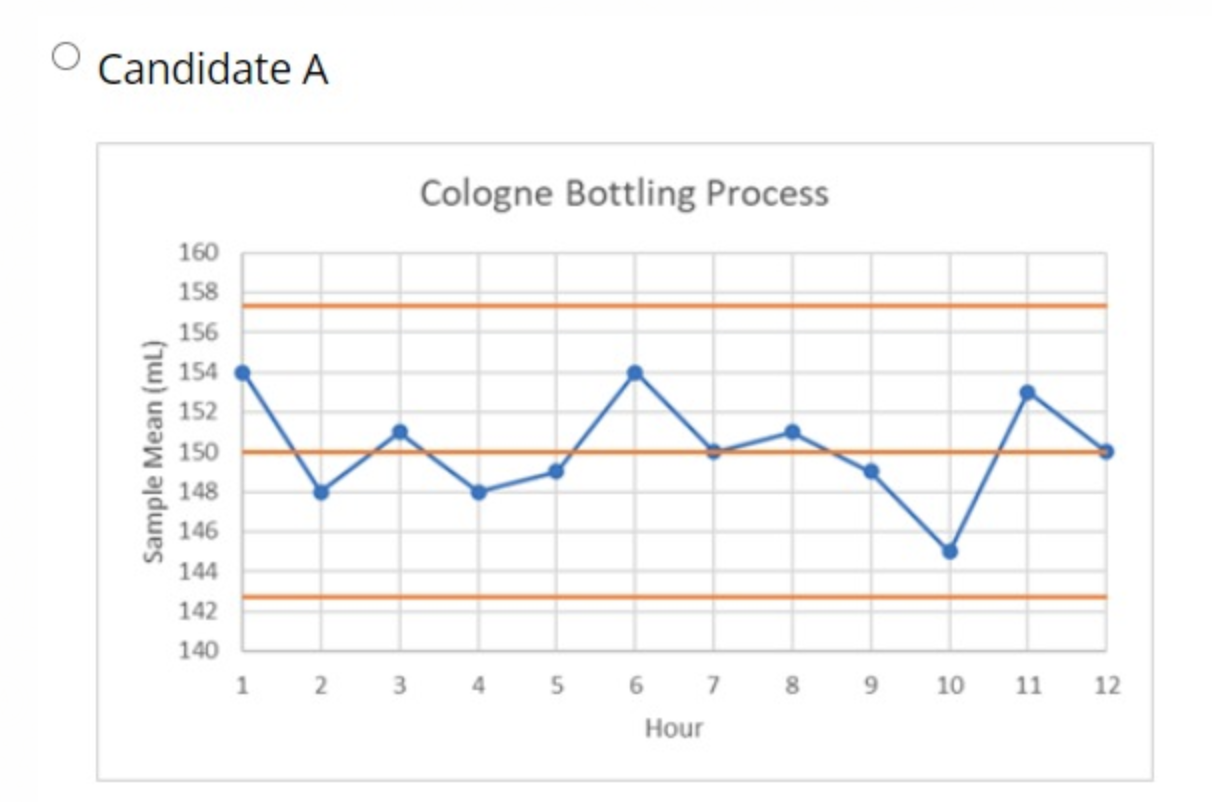
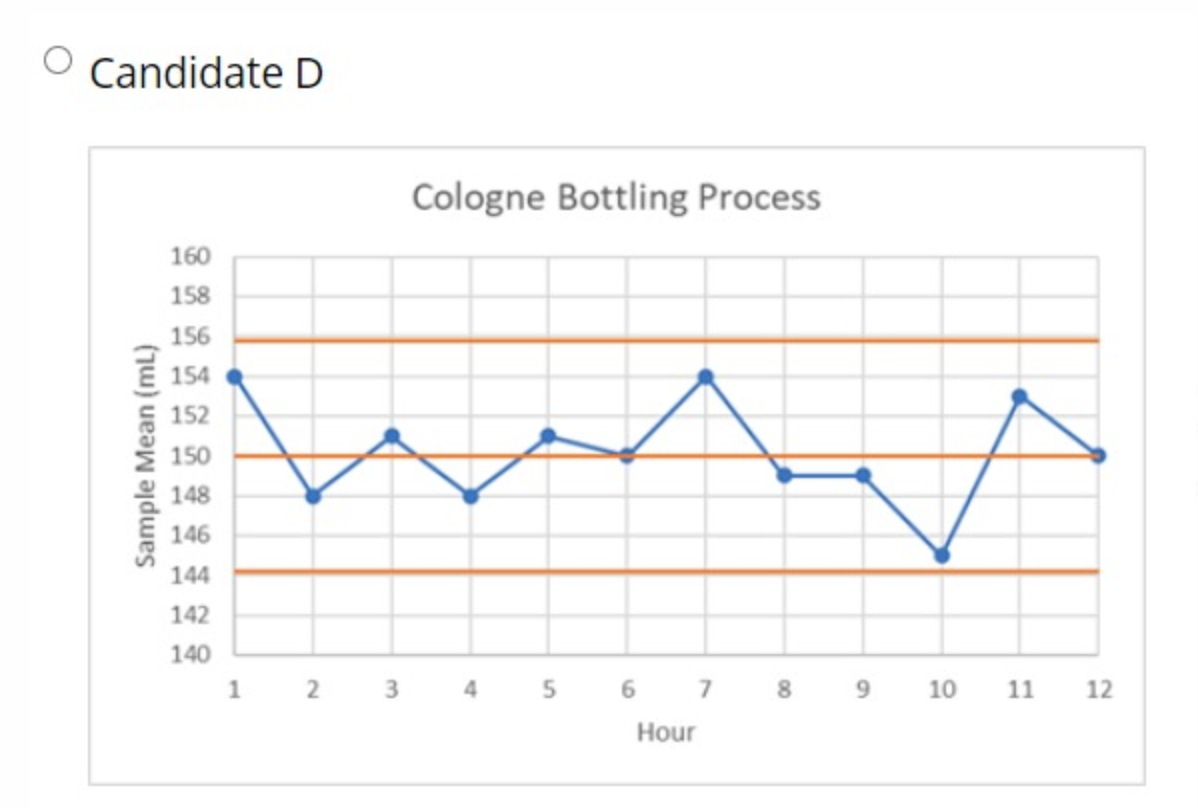
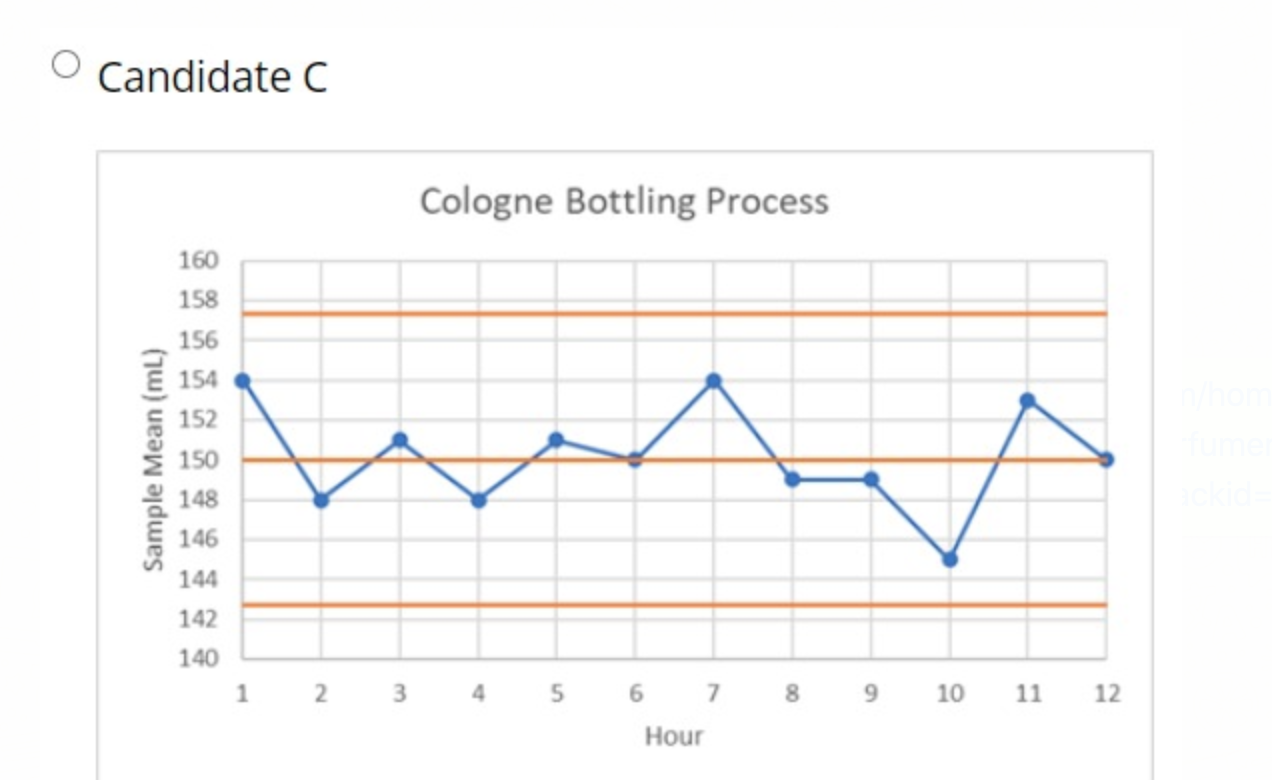
As the operations manager for a high-end perfumer, you are looking to hire a junior operations analyst for the quality control department. Four candidates were interviewed and each was asked to plot the p-chart for the following data taken from a cologne bottle filling process: 3= 150 mL, R= 10 mL, sample size = 4 Hour Sample Mean 1 154 2 148 3 151 4 148 5 6 151 150 154 7 8 9 149 149 145 10 11 153 12 150 Which candidate correctly plotted the data? O candidate B Cologne Bottling Process Sample Mean (mL) 160 158 156 154 152 150 148 146 144 142 140 1 2 3 4 5 6 7 8 9 10 11 12 Hour O Candidate D Cologne Bottling Process 160 158 156 154 152 Sample Mean (ml) 150 148 146 144 142 140 1 2 3 4 5 10 11 12 6 7 8 9 Hour Candidate C Cologne Bottling Process 160 158 156 154 152 Sample Mean (mL) 150 148 146 144 142 140 1 N 4 5 6 7 8 9 10 11 12 Hour
Step by Step Solution
There are 3 Steps involved in it
1 Expert Approved Answer
Step: 1 Unlock

Question Has Been Solved by an Expert!
Get step-by-step solutions from verified subject matter experts
Step: 2 Unlock
Step: 3 Unlock