

Question: As you can see in the graph below, two alternatives of A and B are compared to each other. What do x% and y% represent?

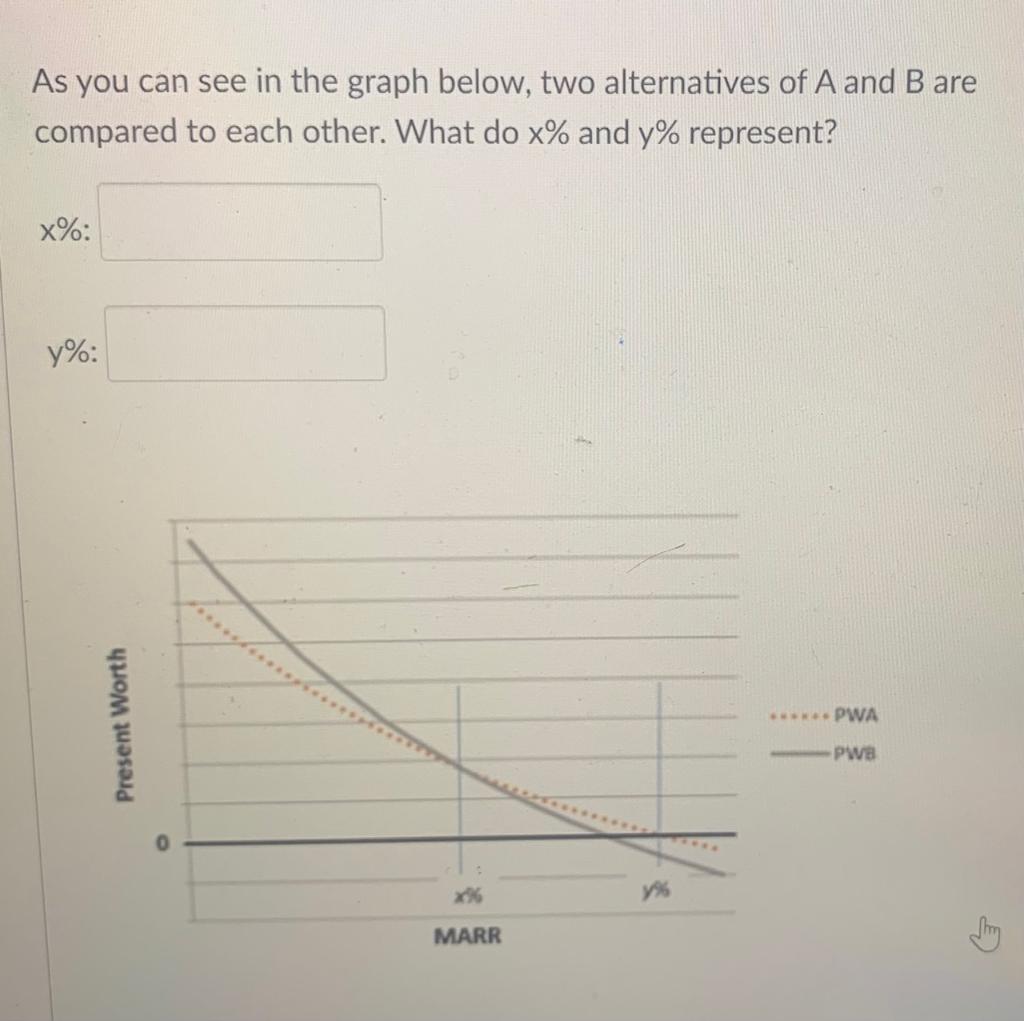
As you can see in the graph below, two alternatives of A and B are compared to each other. What do x% and y% represent? X%: y%: .................> . .. .. . PWA Present Worth -PWa 0 y%% MARR Thry
Step by Step Solution
There are 3 Steps involved in it
1 Expert Approved Answer
Step: 1 Unlock

Question Has Been Solved by an Expert!
Get step-by-step solutions from verified subject matter experts
Step: 2 Unlock
Step: 3 Unlock