Question: As you read through section 2, you will see formulas and examples for each of the following five forecasting techniques Simple Moving Average Weighted Average

As you read through section 2, you will see formulas and examples for each of the following five forecasting techniques

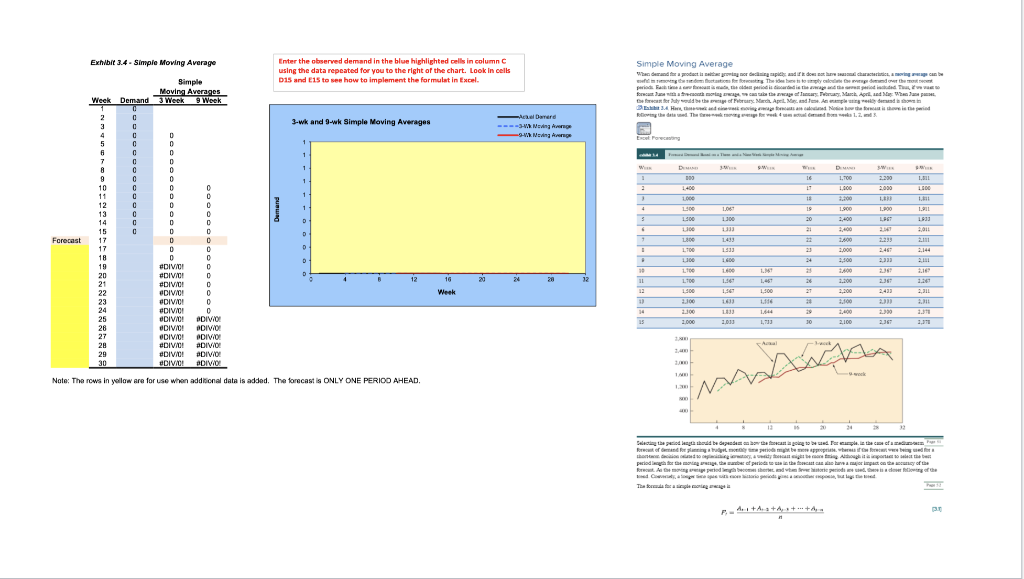
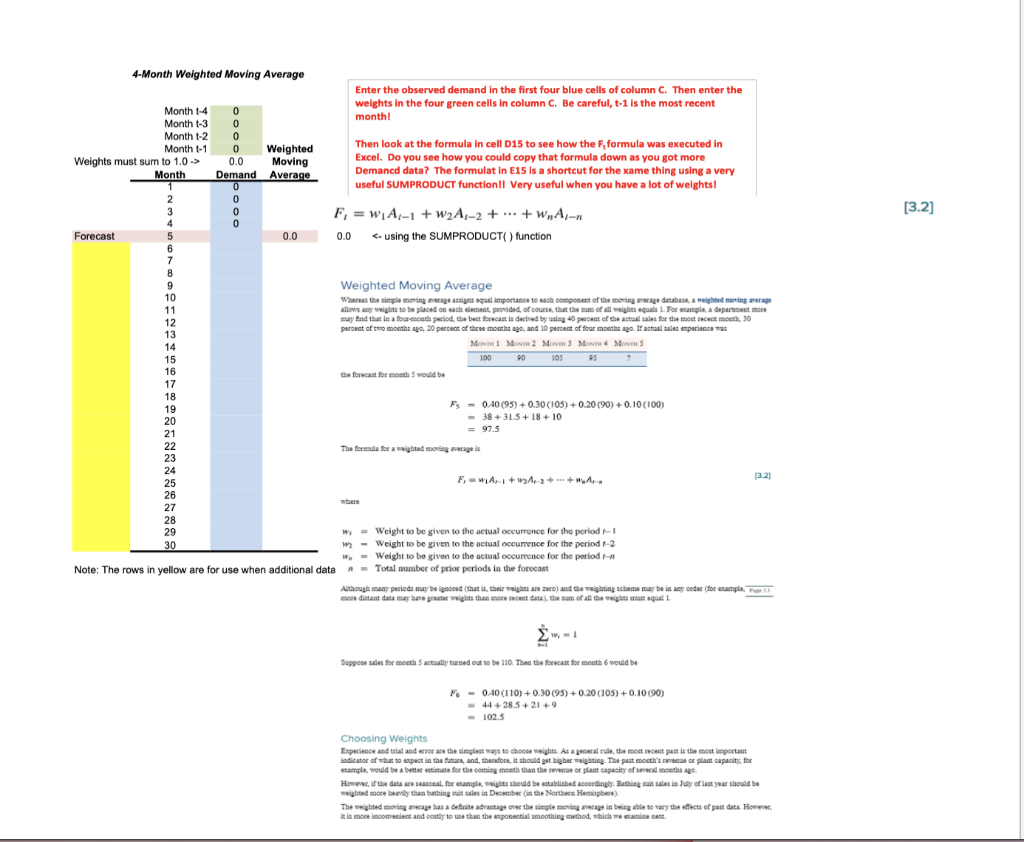
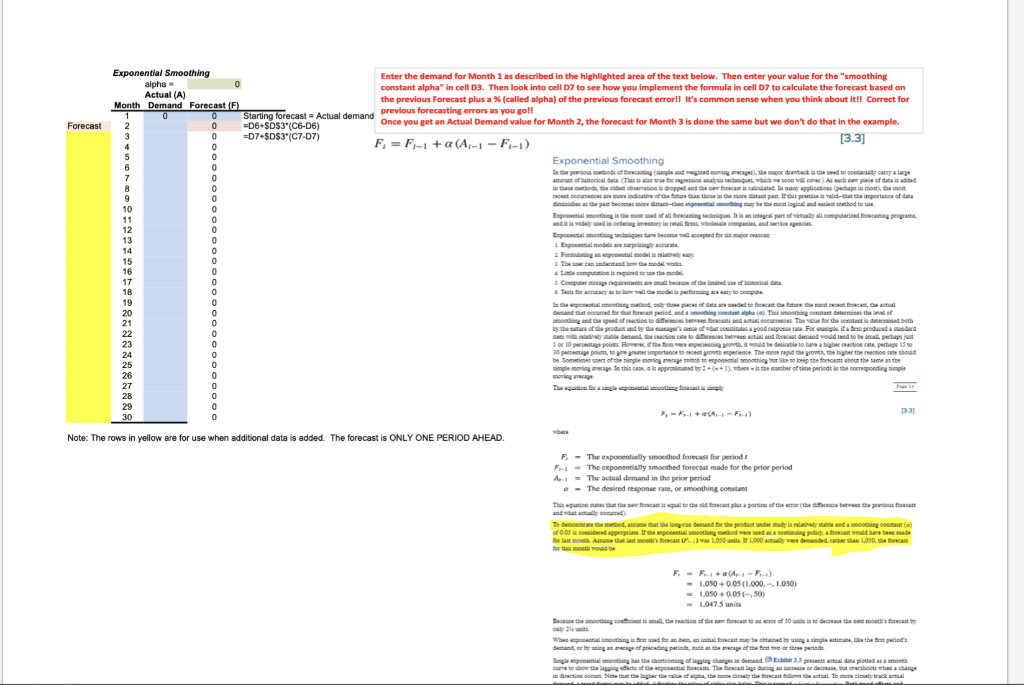
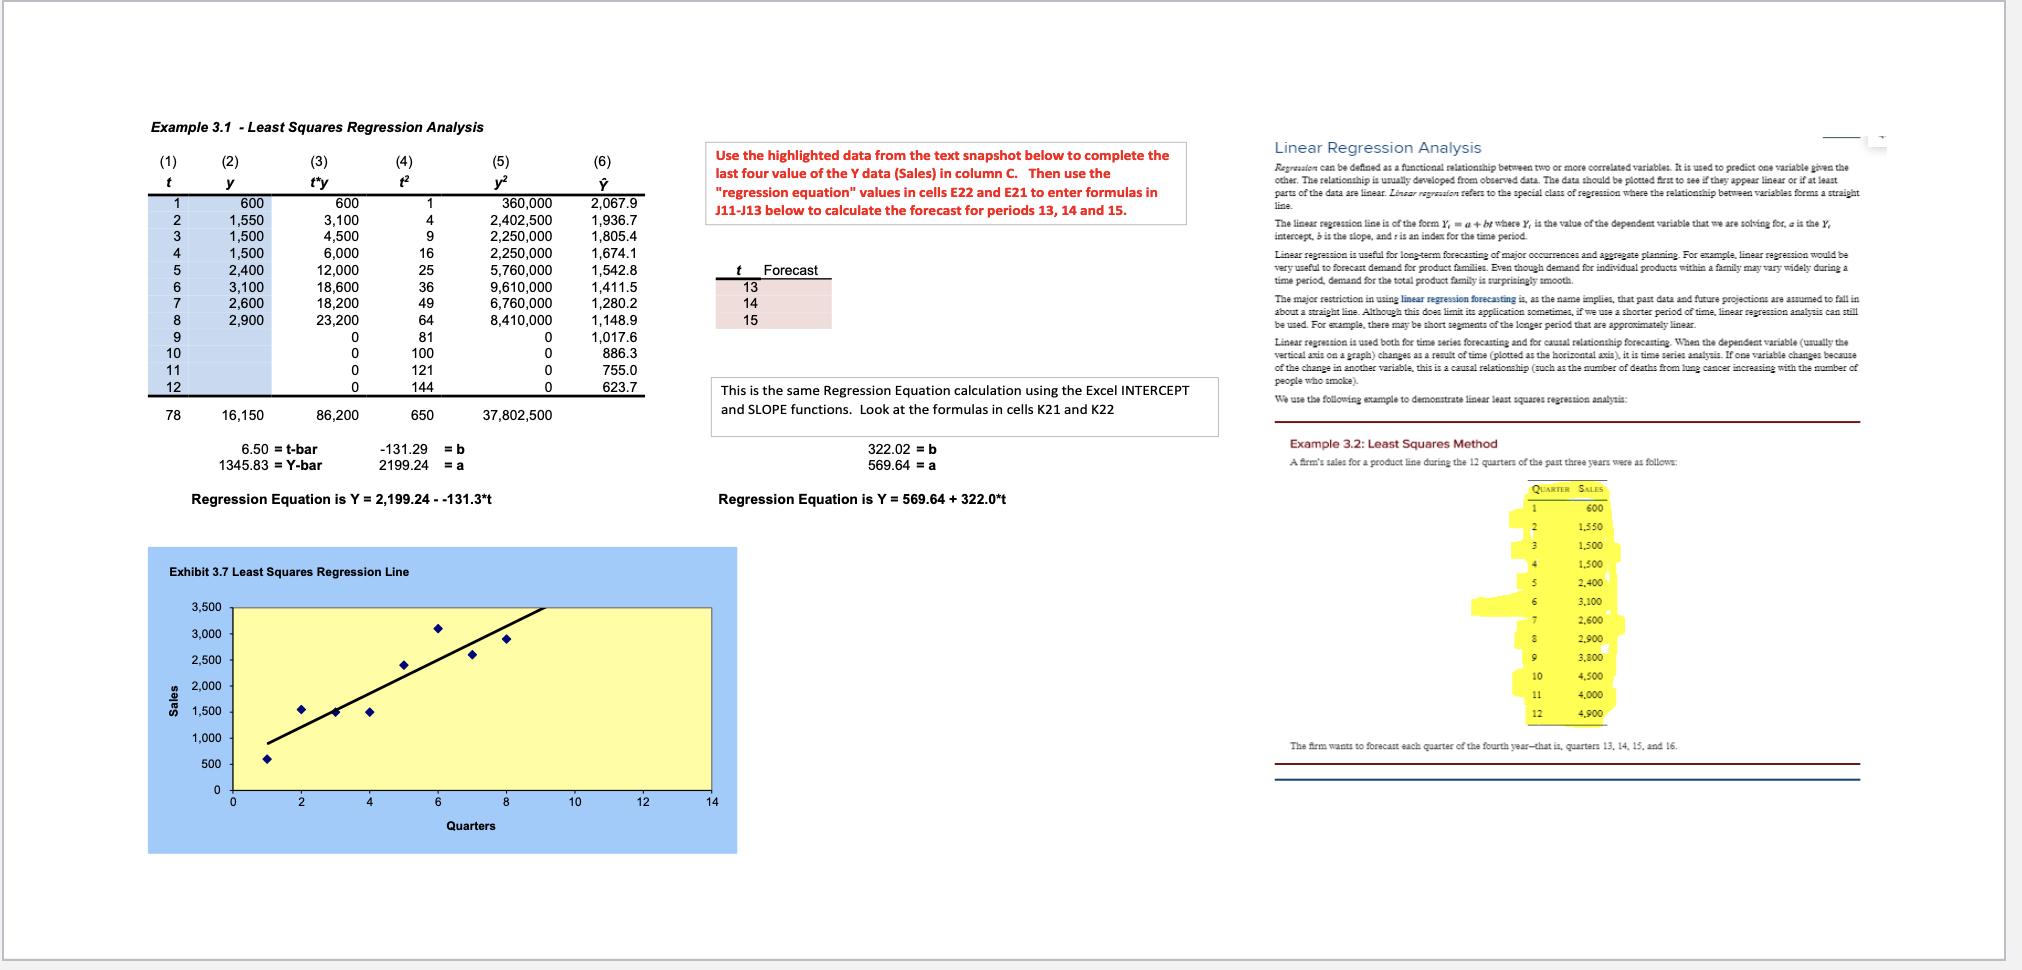
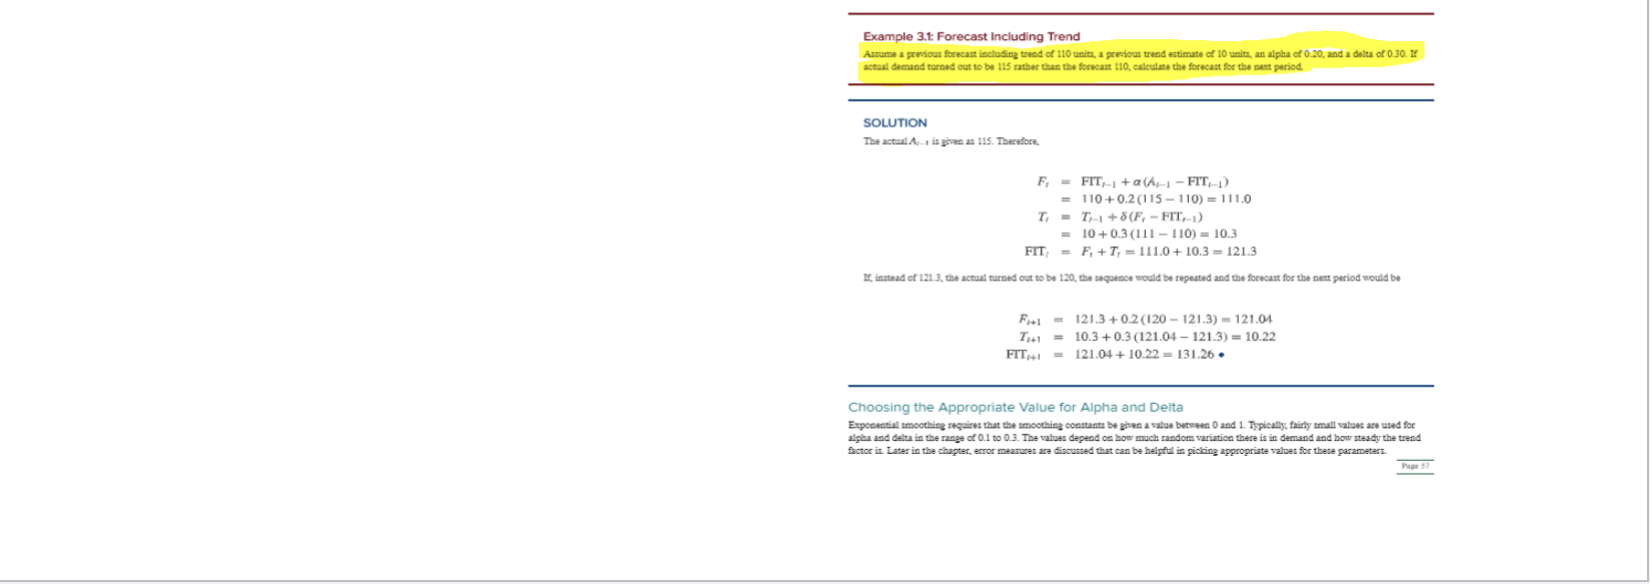
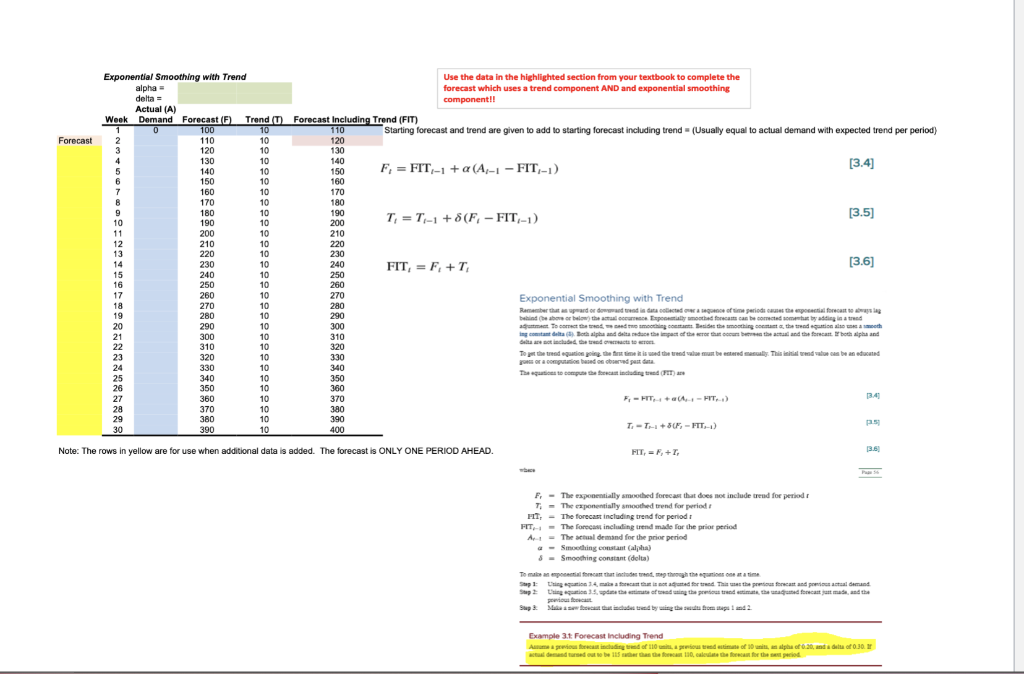
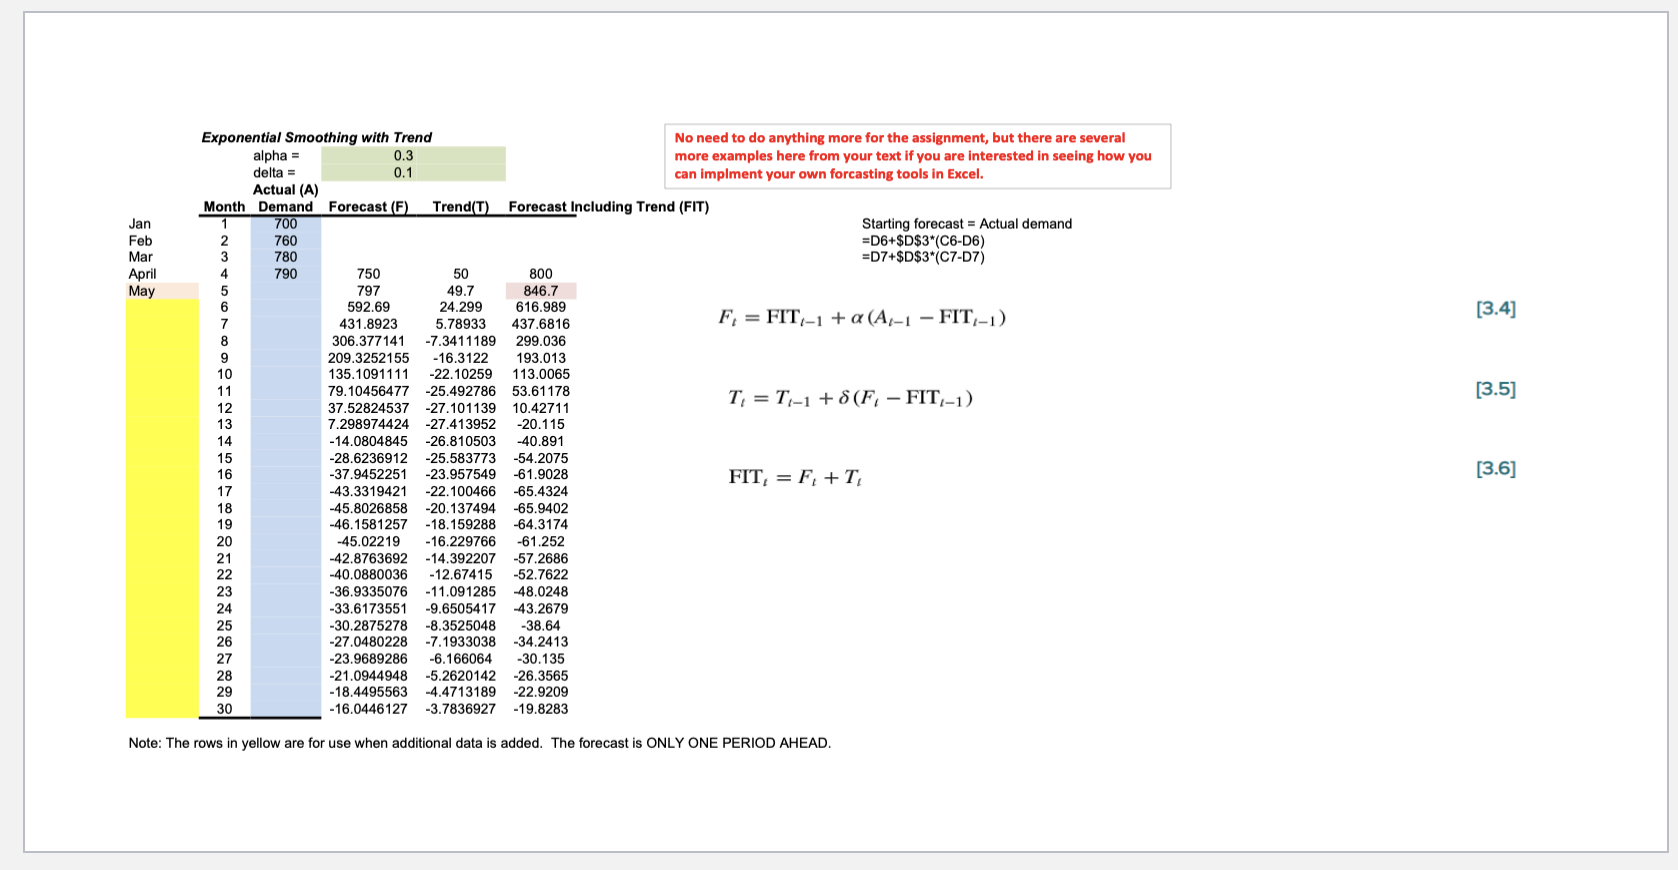
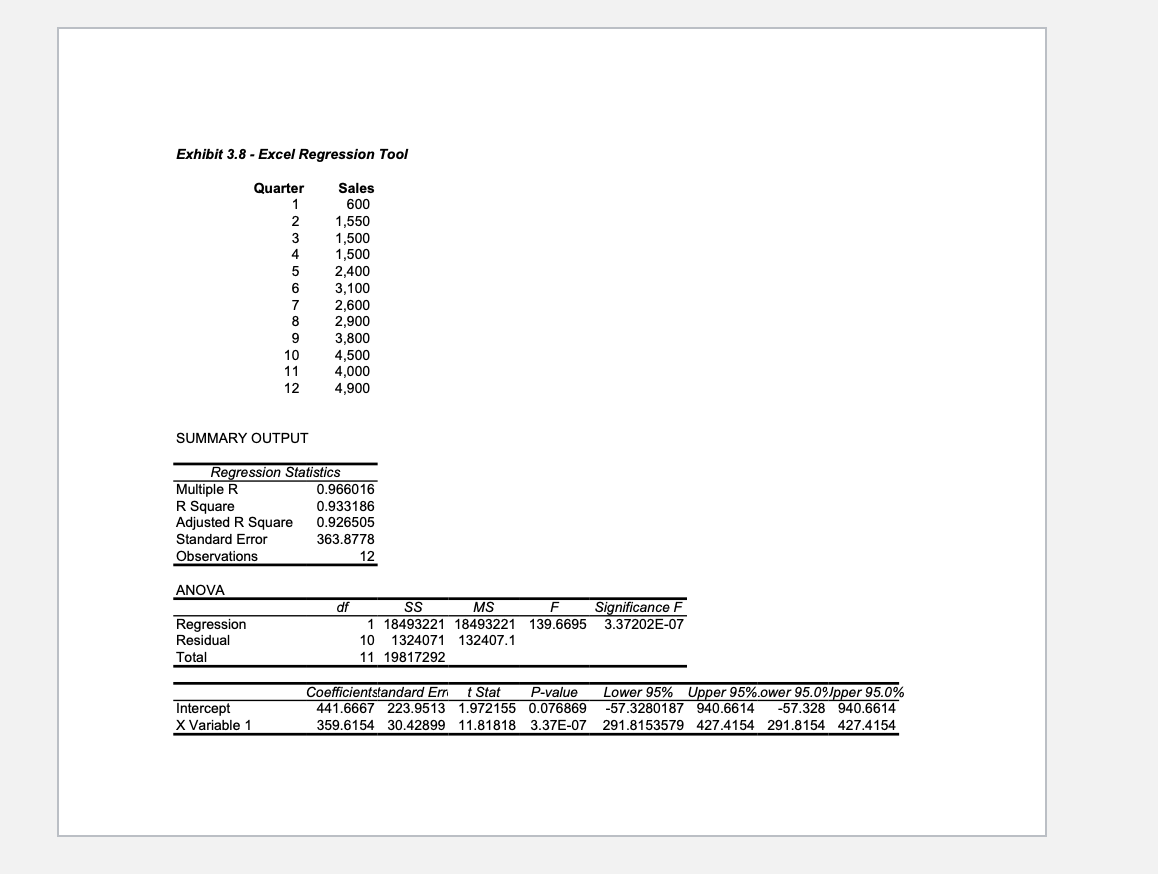
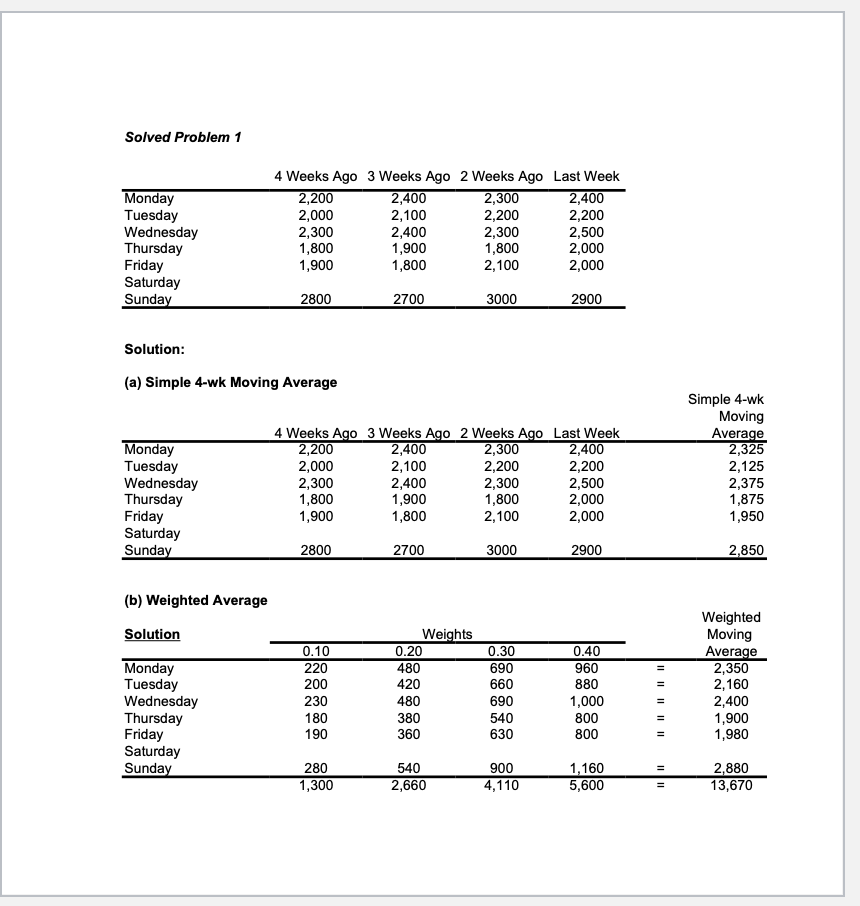
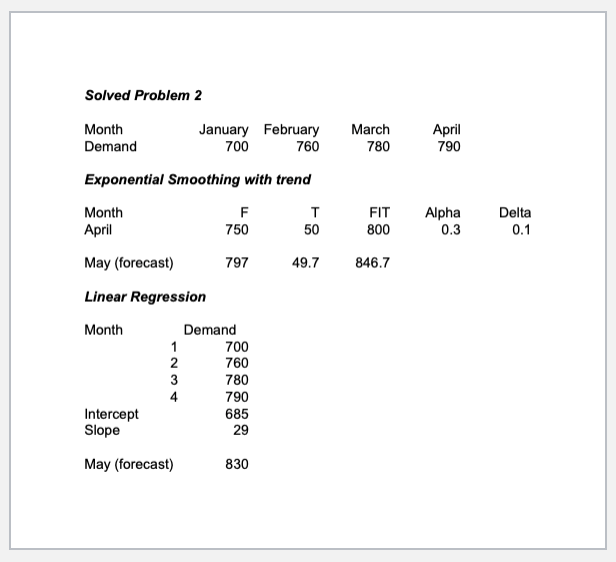
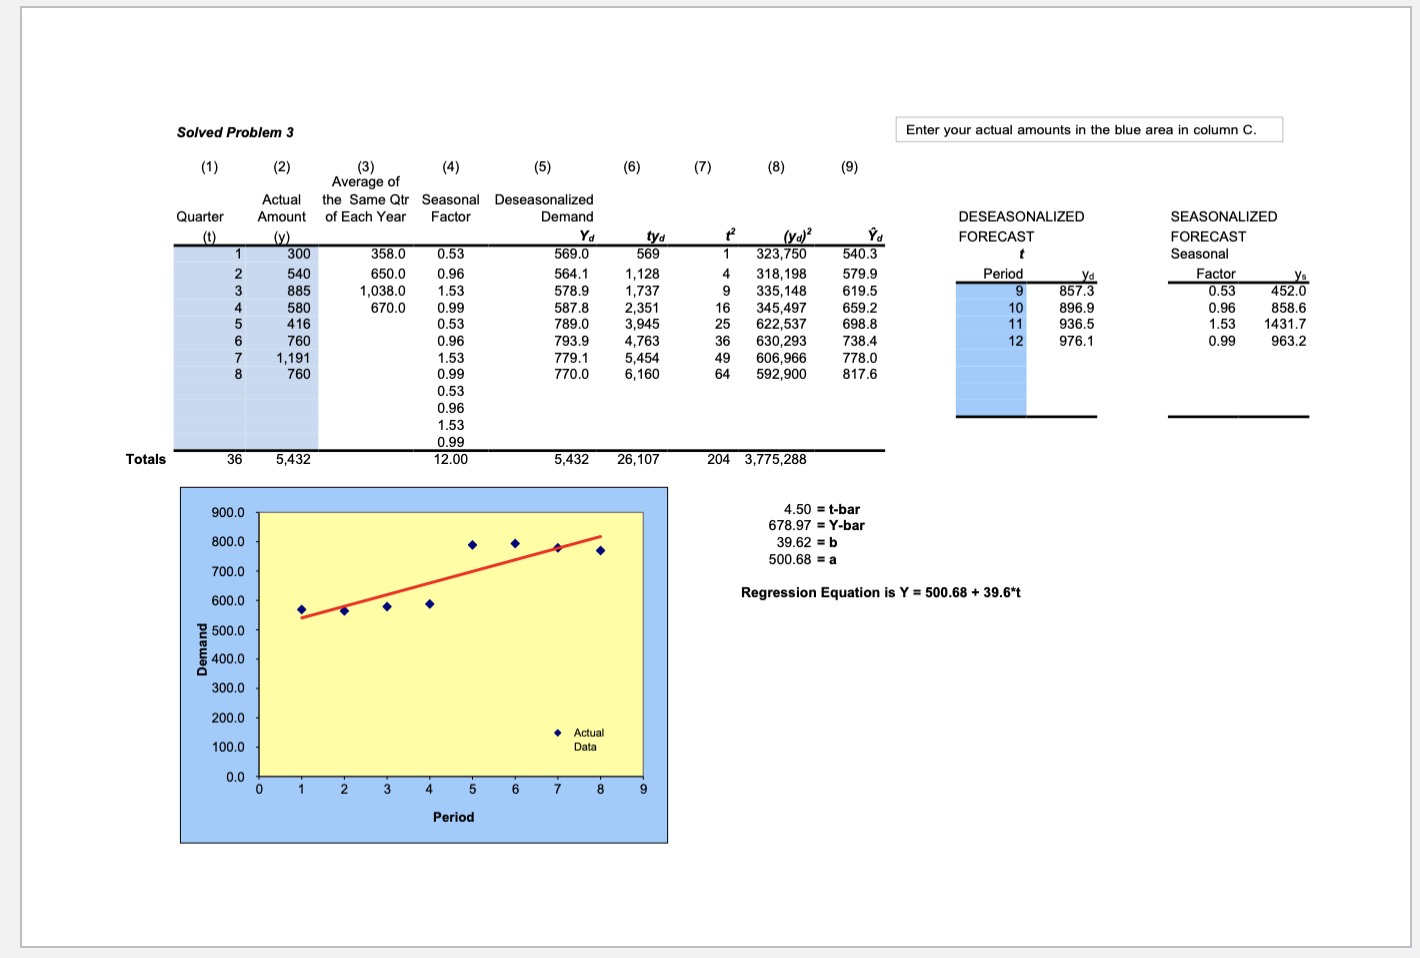
Simple Moving Average Weighted Average Exponential Smoothing Exponential Smoothing with Trend Linear Regression

For each of the five forecasting techniques, there is a sheet in the workbook with a blue highlighted tab. For each of those first five sheets, fill in data used in the textbook examples in Section 3.2 to see the forecasting technique implemented in Excel. (Actual Data columns, the required Smoothing Constants or Weights, and any other starting Forecast values needed for the forecasting technique). Your final forecast should match the one in the textbook if correct.

Upload your completed workbook.

Be sure to look into the Excel formulas for each forecast and match it to the appropriate equation from the text. You won't need to recreate these sheets for this course, but those of you with desires to distinguish yourself using your quantitative skills should try recreating them on your own.

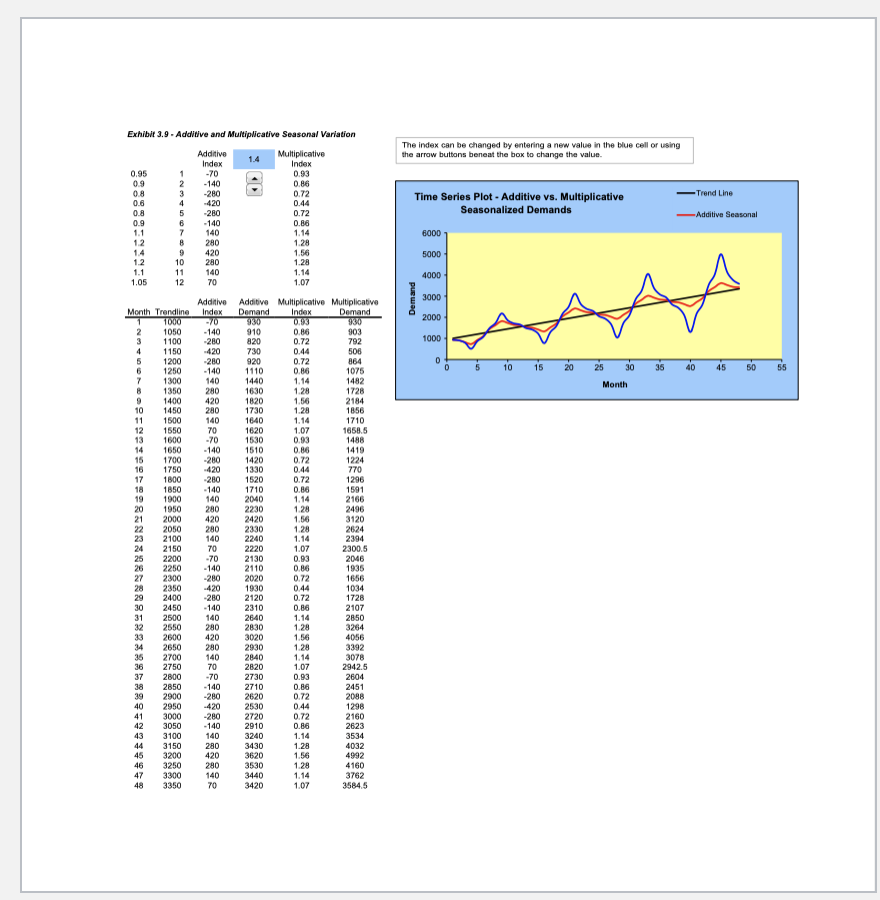
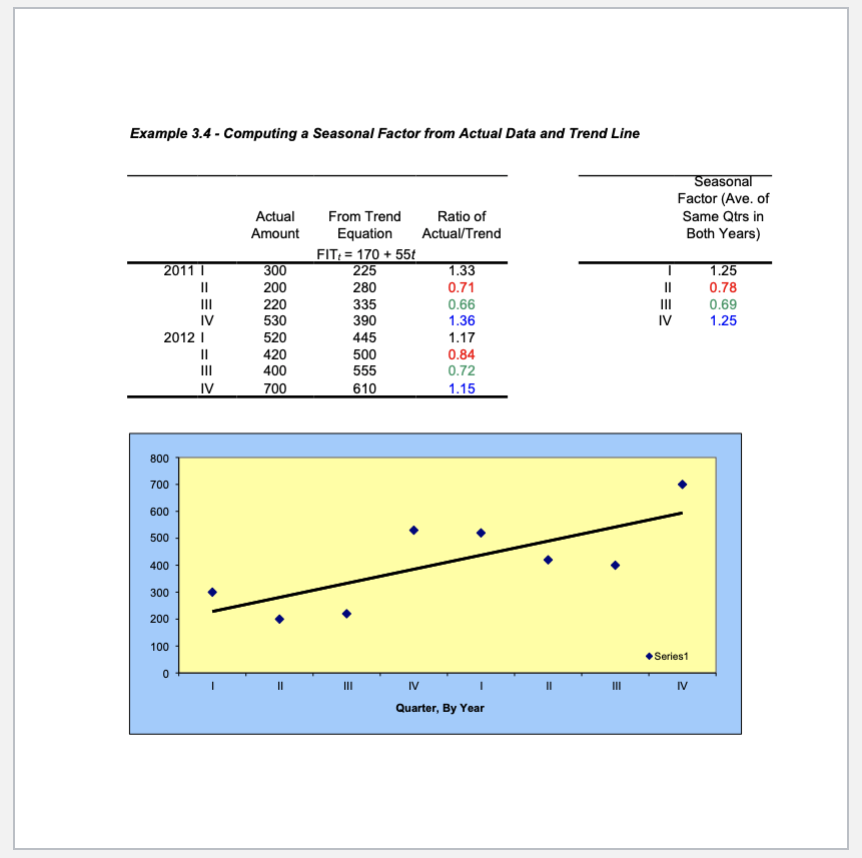
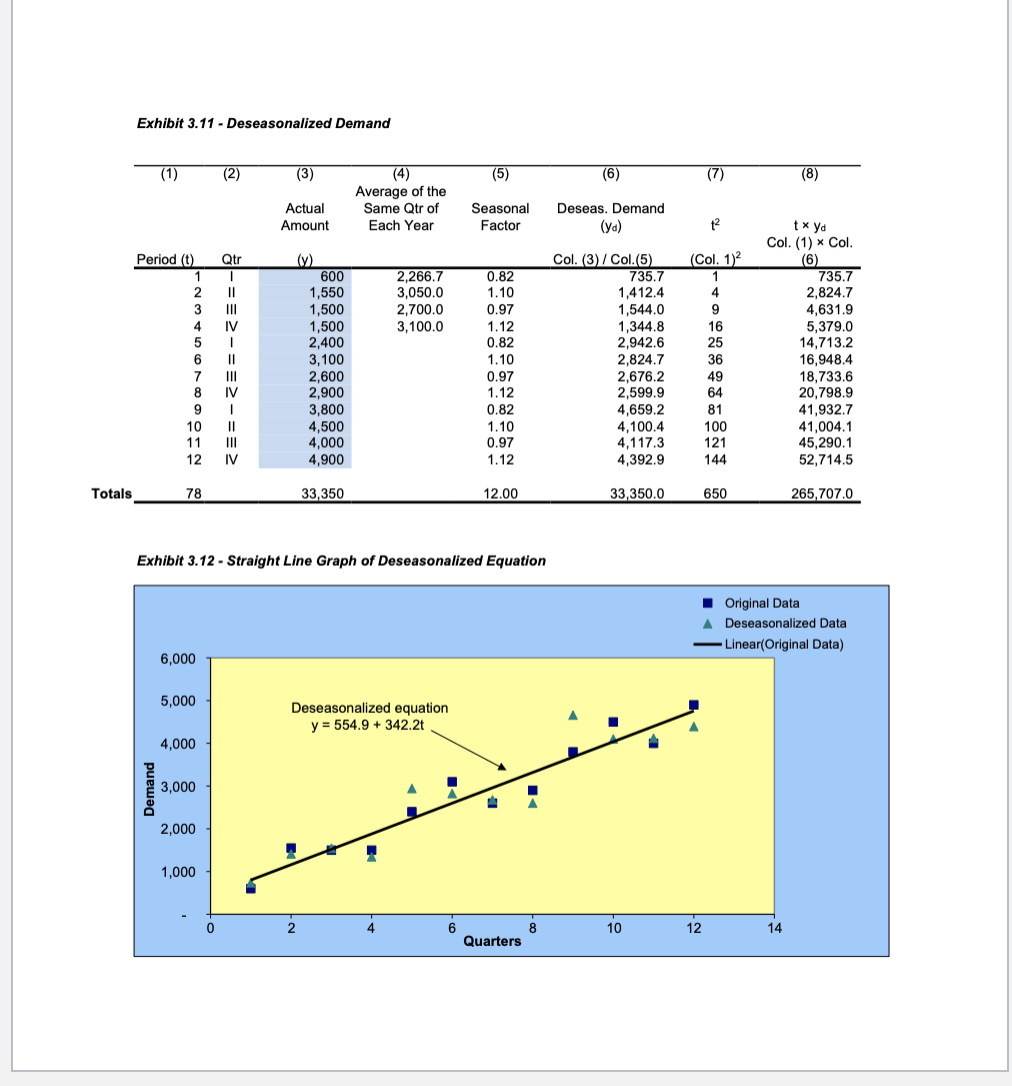
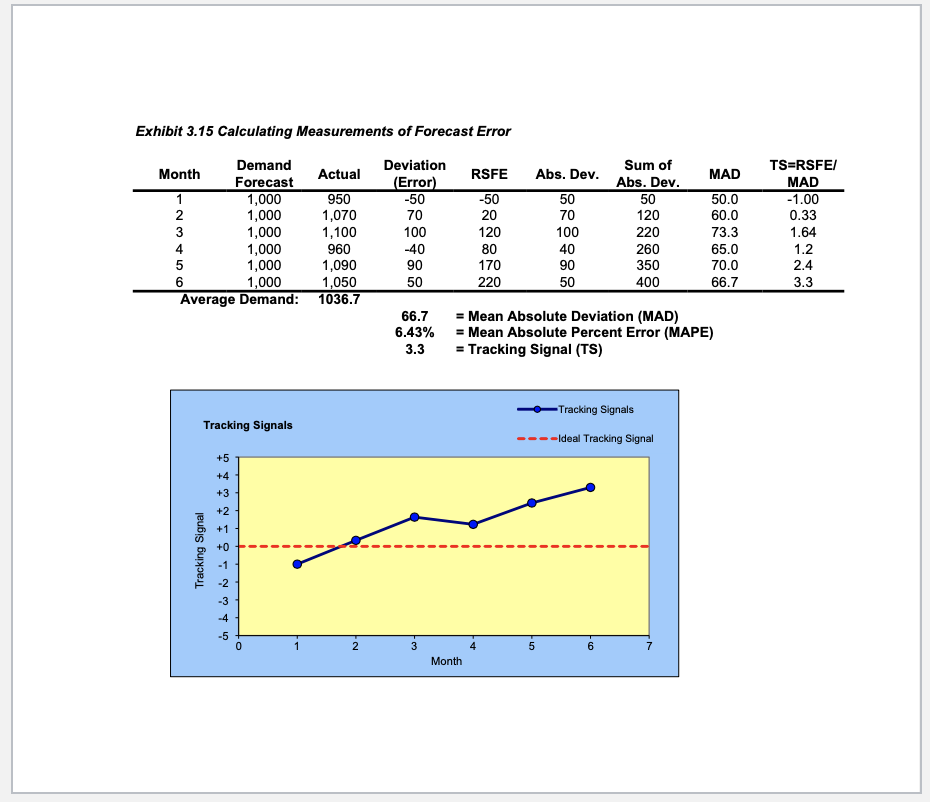
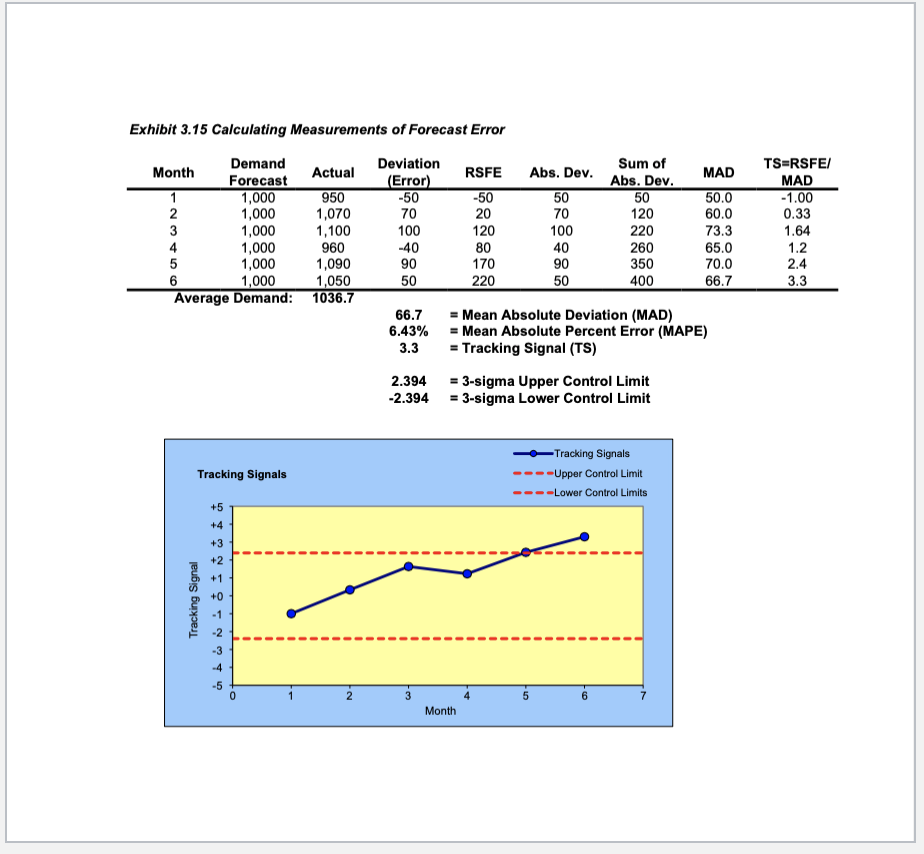
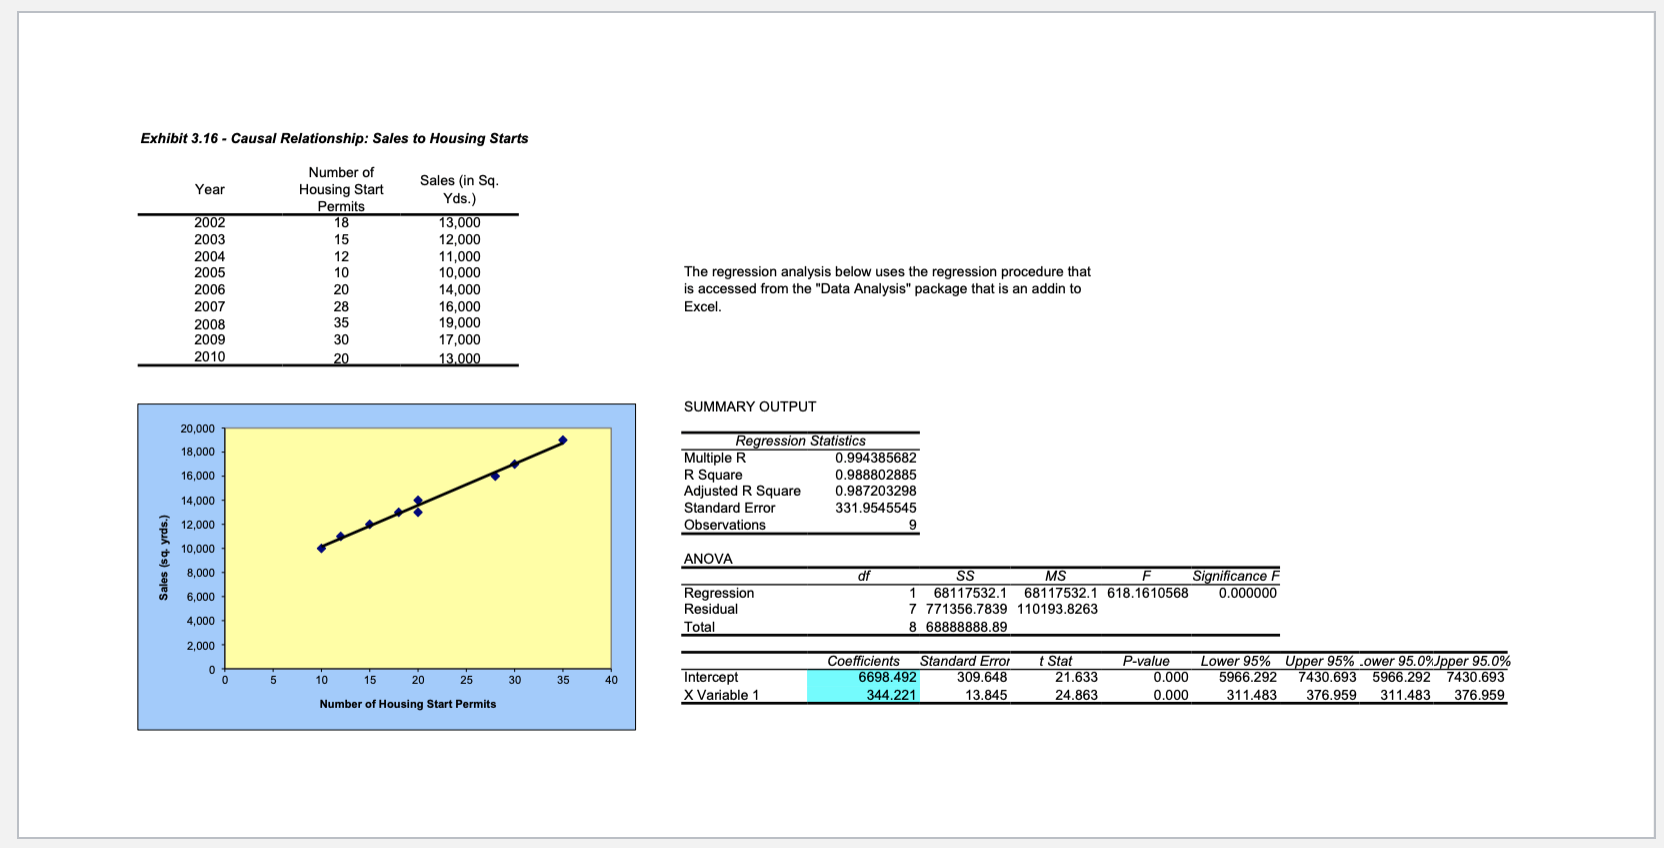
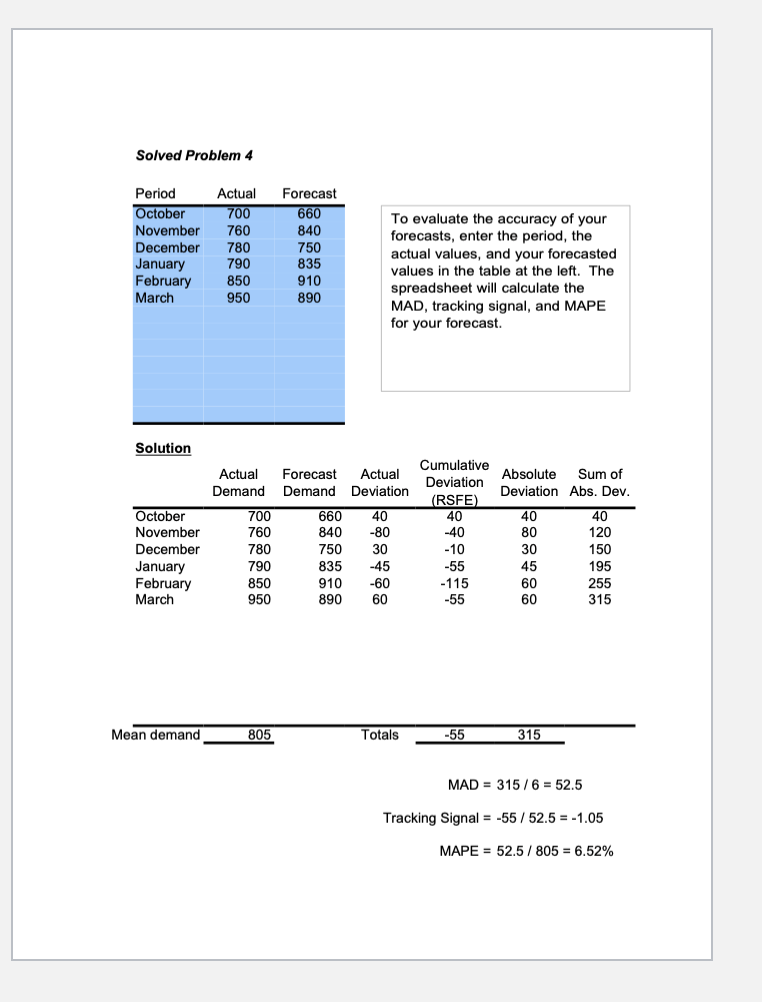
Use the remaining worksheets as reference as you read through other forecasting techniques and forecast error measurement in the remainder of the chapter.

As you read through section 2, you will seeAs you read through section 2, you will seeAs you read through section 2, you will seeAs you read through section 2, you will seeAs you read through section 2, you will seeAs you read through section 2, you will seeAs you read through section 2, you will seeAs you read through section 2, you will seeAs you read through section 2, you will seeAs you read through section 2, you will seeAs you read through section 2, you will seeAs you read through section 2, you will seeAs you read through section 2, you will seeAs you read through section 2, you will seeAs you read through section 2, you will seeAs you read through section 2, you will seeAs you read through section 2, you will seeAs you read through section 2, you will see

Note: Tha rowa in yellow are for Lse whan addiscnal data is added. The forecast is ONLY ONE PERICO AHEAD. F7=nA1+A12+A1++A2= 4-Month Weighted Moving Average Enter the observed demand in the first four blue cells of column C. Then enter the weights in the four green cells in column C. Be careful, t-1 is the most recent month! Then look at the formula in cell D15 to see how the Ft formula was executed in Excel. Do you see how you could copy that formula down as you got more Demancd data? The formulat in E15 is a shortcut for the xame thing using a very useful SUMPRODUCT functionII Very useful when you have a lot of weights! Ft=w1At1+w2At2++wnAln 0.0

Step by Step Solution

There are 3 Steps involved in it

1 Expert Approved Answer
Step: 1 Unlock blur-text-image
Question Has Been Solved by an Expert!

Get step-by-step solutions from verified subject matter experts

Step: 2 Unlock
Step: 3 Unlock

Students Have Also Explored These Related General Management Questions!