

Question: AS-AD Economic Analysis Focus Using the AS-AD framework to think about the first-order macroeconomic dynamics that affect and reveal where an economy lies relative to

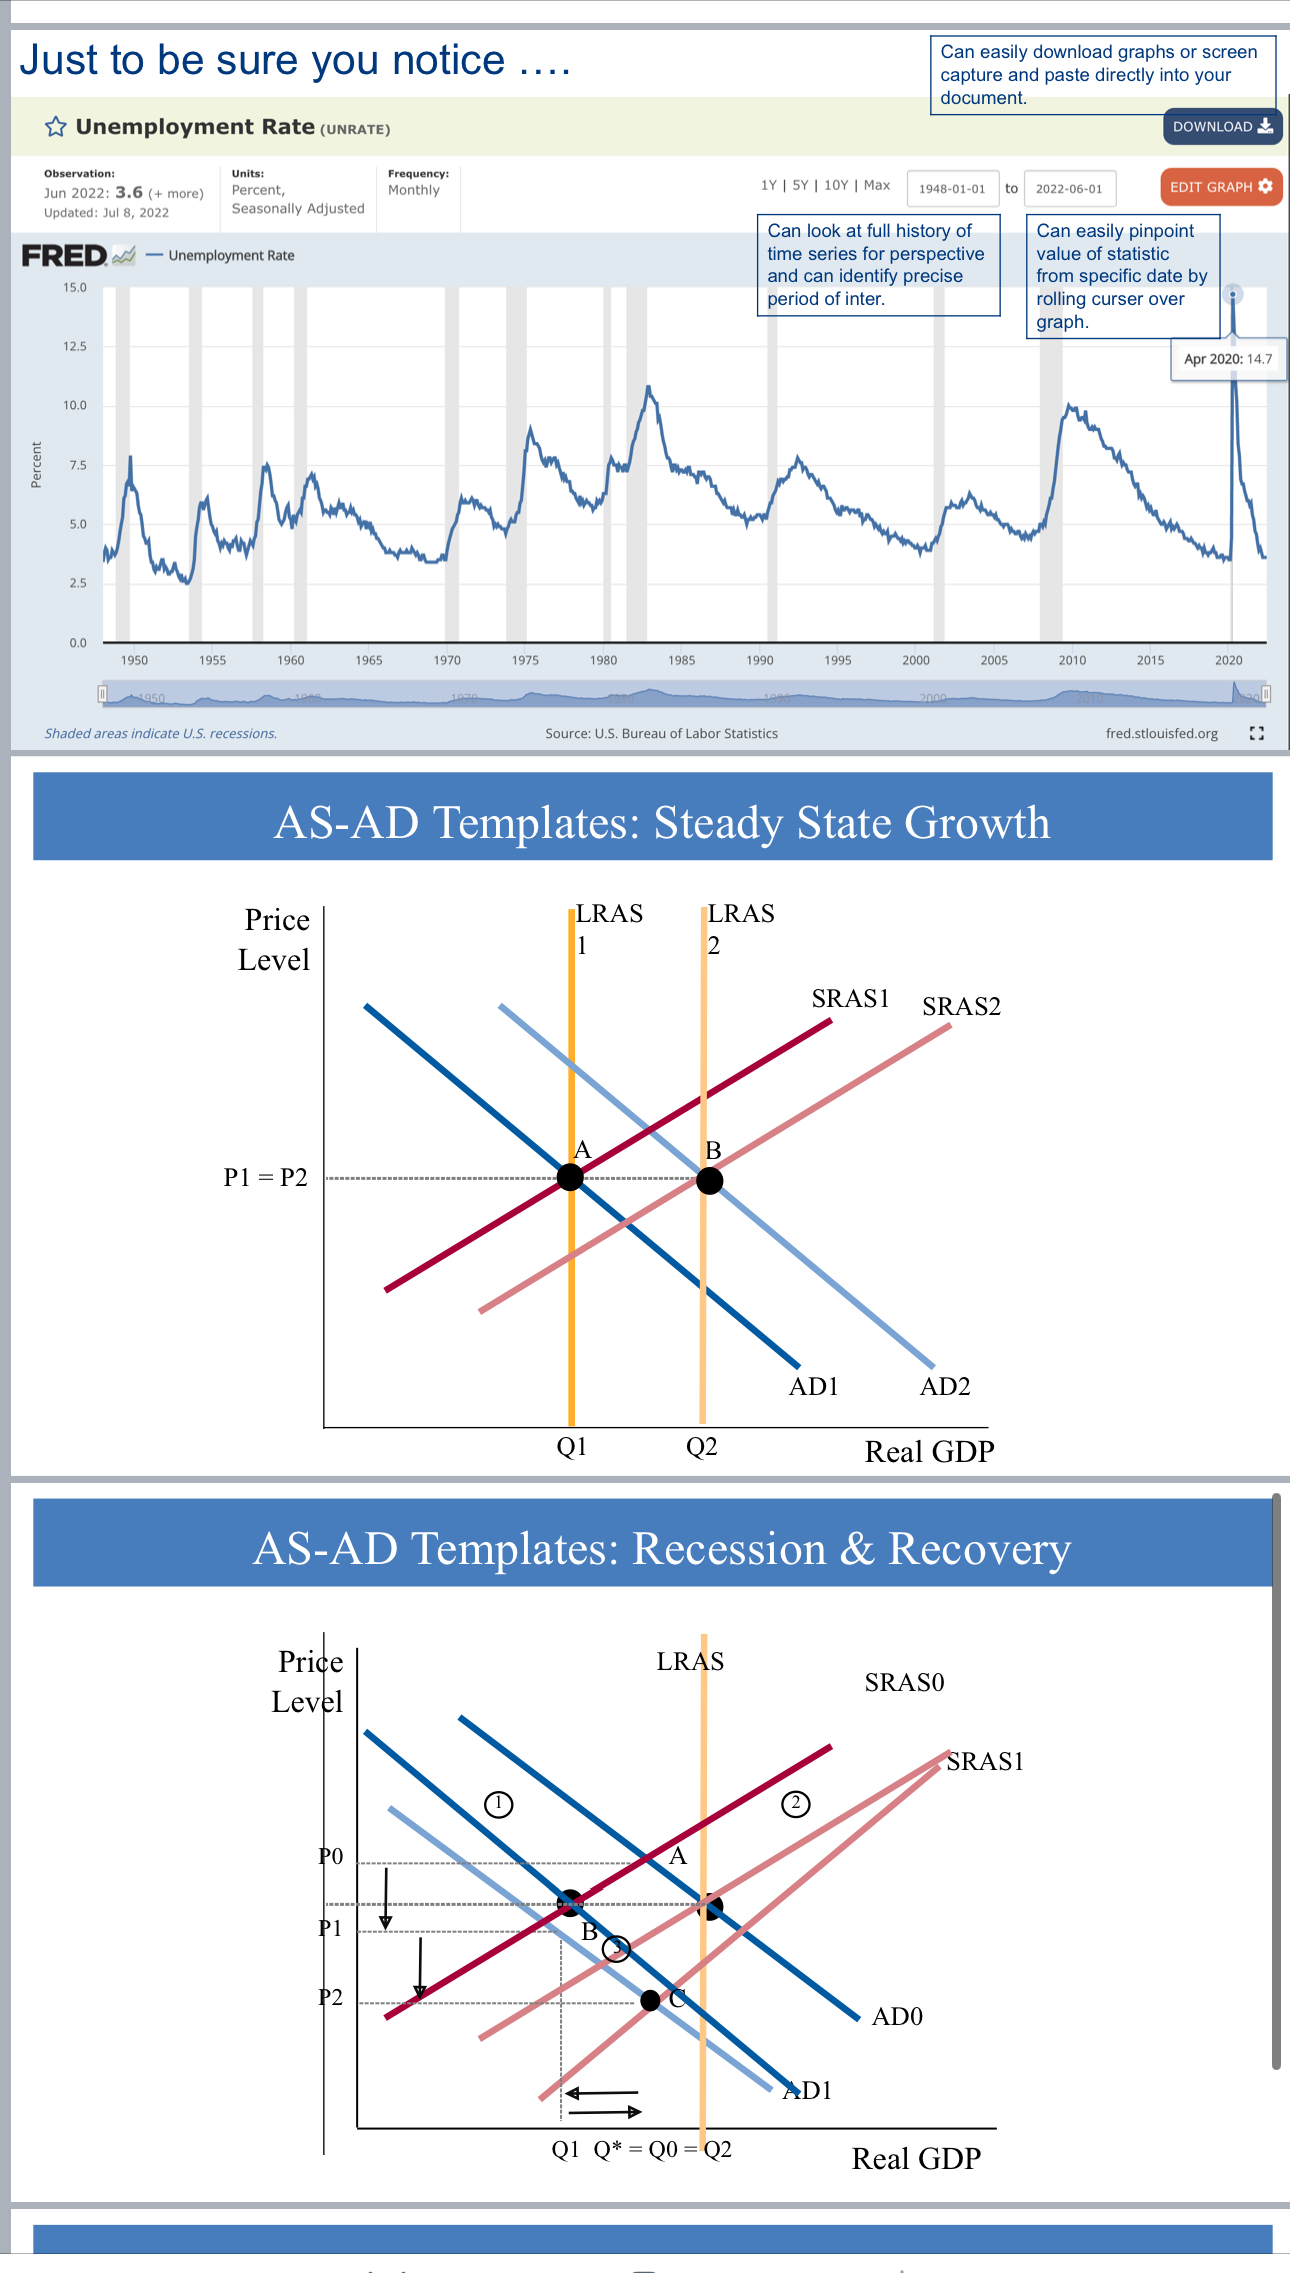
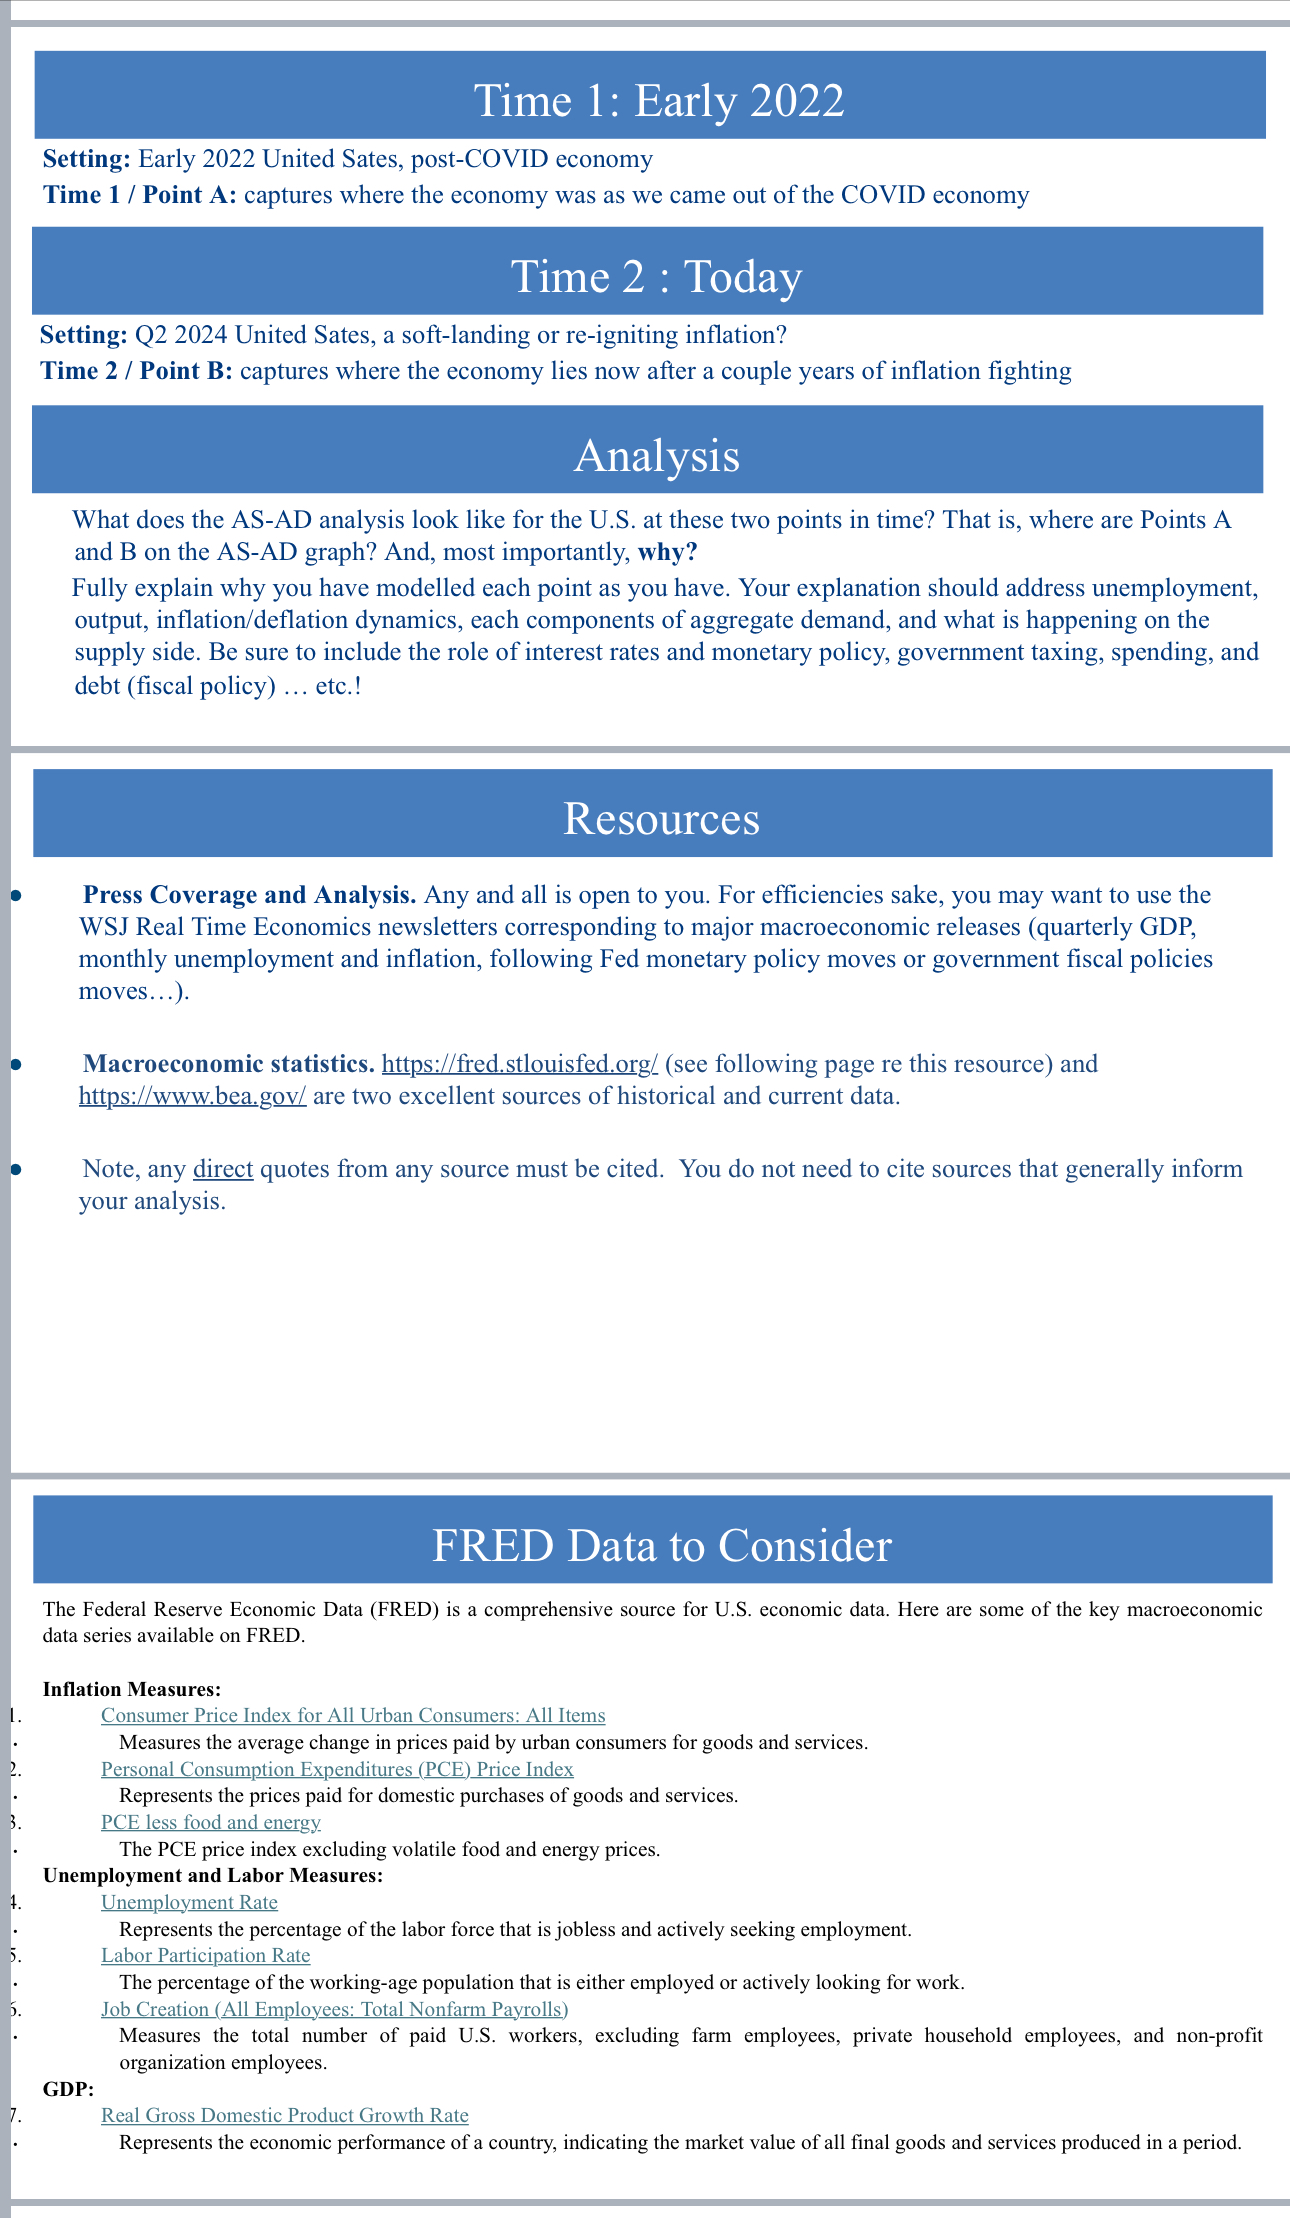
AS-AD Economic Analysis Focus Using the AS-AD framework to think about the first-order macroeconomic dynamics that affect and reveal where an economy lies relative to its potential (output gap) and the price pressure is associated with that. Note: The AEE (\"all else equal\") conceptual tool should be used liberally! Resources May use all course materials; template graphics are provided but you may generate the AS-AD graphs in whatever manner is most effective and efficient for you May use any data (and data graph) sources; must be cited May incorporate analysis of others (in the press, on the internet) to inform your analysis; it must be captured in the frameworks we use in this course (stripped down analysis using our simple frameworks is better than complex analysis parroting someone else); cited. Deliverable A short slide deck answering questions with graphical analysis and (graphical) data support. Explanation (bullet points) of each curve shift and of the reasonableness of your depiction of where the economy is at each point with respect to the price pressure and the output gap AS-AD Economic Analysis Guidelines Be sure to provide full explanation/support for each of the curve shifts and the corresponding short-run SRAS-AD equilibrium point at each time. Remember, the short-run equilibrium point is determined by where the economy lands with respect to price pressure (upward, downward, none) and the output gap (negative, positive, none). {While the output gap is captured in the AS-AD model in terms of realized real GDP relative to LRAS, there is a richer set of economic data available to characterize this gap such as unemployment, labor participation, industrial production ... } Be sure to capture what happens to the drivers of SRAS (cost of major intermediate materials, cost of capital, cost of labor, expected future profits...) and to the drivers of AD (C, I, G, NX and what drives each of these components) We are not looking for a \"right answer\" but instead for good explanations to justify \"an answer.\" A Note on Academic Integrity It is a violation of the honor code to copy anyone else's work new or old - in this submission. You may work with your assigned partner, that is it. You may not copy any portion of work done for this assignment from a current classmate or from material obtain directly or indirectly - from any students who have taken this course and tackled this assignment in the past. You may use any and all other resources. 1t is going to take some work. Do the work. Carefully, thoughtfully and thoroughly addressing this assignment will cement the foundation of understanding macroeconomic that you have built over the last four weeks AND, conveniently, will put you miles ahead in preparing for the final exam T Q & Dashboard Calendar To Do Notifications Inbox Just to be sure you notice .... Can easily download graphs or screen capture and paste directly into your document. Unemployment Rate (UNRATE) DOWNLOAD Observation: Units: Frequency: Jun 2022: 3.6 (+ more) Percent, Monthly 1Y | 5Y | 10Y | Max 1948-01-01 to 2022-06-01 EDIT GRAPH Updated: Jul 8, 2022 Seasonally Adjusted Can look at full history of Can easily pinpoint FRED - Unemployment Rate time series for perspective value of statistic 15.0 and can identify precise from specific date by period of inter. rolling curser over graph 12.5 Apr 2020: 14.7 10.0 Percent 7.5 5.0 2.5 0.0 1950 1955 1960 1965 1970 1975 1980 1985 1990 1995 2000 2005 2010 2015 2020 Shaded areas indicate U.S. recessions. Source: U.S. Bureau of Labor Statistics fred.stlouisfed.org AS-AD Templates: Steady State Growth Price LRAS LRAS Level 2 SRASI SRAS2 A B P1 = P2 ADI AD2 Q1 Q2 Real GDP AS-AD Templates: Recession & Recovery Price LRAS SRASO Level SRASI 2 PO A BO P2 ADO ADI Q1 Q* = Q0 =Q2 Real GDPTime 1: Early 2022 Setting: Early 2022 United Sates, post-COVID economy Time 1/ Point A: captures where the economy was as we came out of the COVID economy Time 2 : Today Setting: Q2 2024 United Sates, a soft-landing or re-igniting inflation? Time 2 / Point B: captures where the economy lies now after a couple years of inflation fighting Analysis What does the AS-AD analysis look like for the U.S. at these two points in time? That is, where are Points A and B on the AS-AD graph? And, most importantly, why? Fully explain why you have modelled each point as you have. Your explanation should address unemployment, output, inflation/deflation dynamics, each components of aggregate demand, and what is happening on the supply side. Be sure to include the role of interest rates and monetary policy, government taxing, spending, and debt (fiscal policy) ... etc.! Resources Press Coverage and Analysis. Any and all is open to you. For efficiencies sake, you may want to use the WSJ Real Time Economics newsletters corresponding to major macroeconomic releases (quarterly GDP, monthly unemployment and inflation, following Fed monetary policy moves or government fiscal policies moves...). Macroeconomic statistics. https:/fred.stlouisfed.org/ (see following page re this resource) and https:/www.bea.gov/ are two excellent sources of historical and current data. Note, any direct quotes from any source must be cited. You do not need to cite sources that generally inform your analysis. FRED Data to Consider The Federal Reserve Economic Data (FRED) is a comprehensive source for U.S. economic data. Here are some of the key macroeconomic data series available on FRED. Inflation Measures: Consumer Price Index for All Urban Consumers: All Items Measures the average change in prices paid by urban consumers for goods and services. Personal Consumption Expenditures (PCE) Price Index Represents the prices paid for domestic purchases of goods and services. PCE less food and energy The PCE price index excluding volatile food and energy prices. Unemployment and Labor Measures: Unemployment Rate Represents the percentage of the labor force that is jobless and actively seeking employment. Labor Participation Rate The percentage of the working-age population that is either employed or actively looking for work. Job Creation (All Employees: Total Nonfarm Payrolls) Measures the total number of paid U.S. workers, excluding farm employees, private household employees, and non-profit organization employees. GDP: Real Gross Domestic Product Growth Rate Represents the economic performance of a country, indicating the market value of all final goods and services produced in a period
Step by Step Solution
There are 3 Steps involved in it

Get step-by-step solutions from verified subject matter experts