

Question: ASAP. Can you please write a memo using as many ration as possible to support the answer. it should be 3 paragraphs. thank you 2
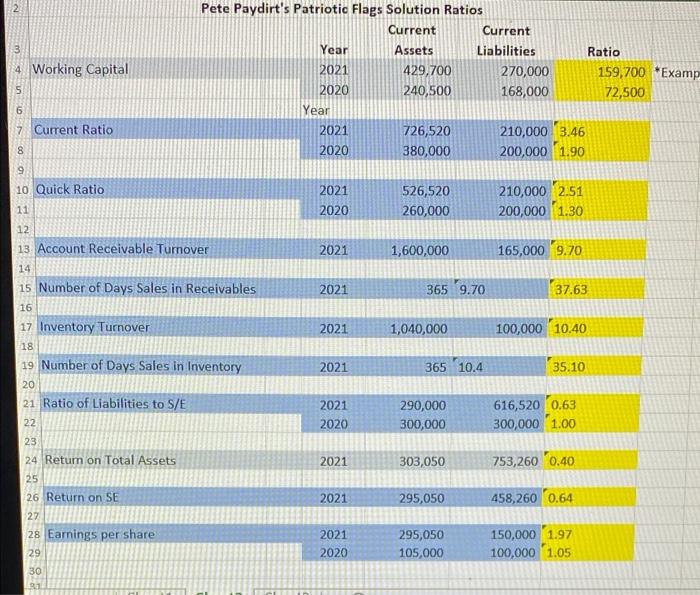
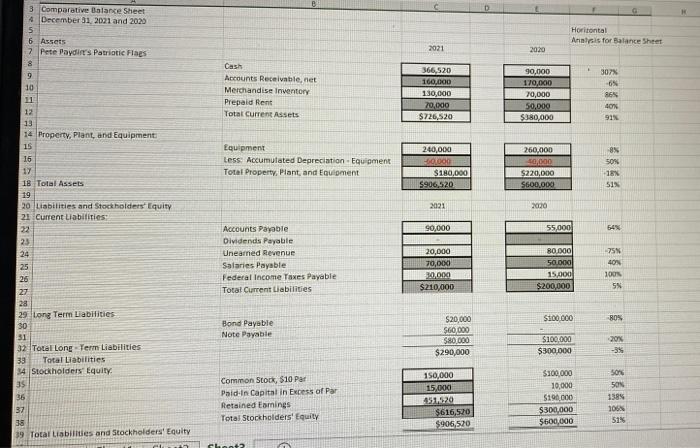
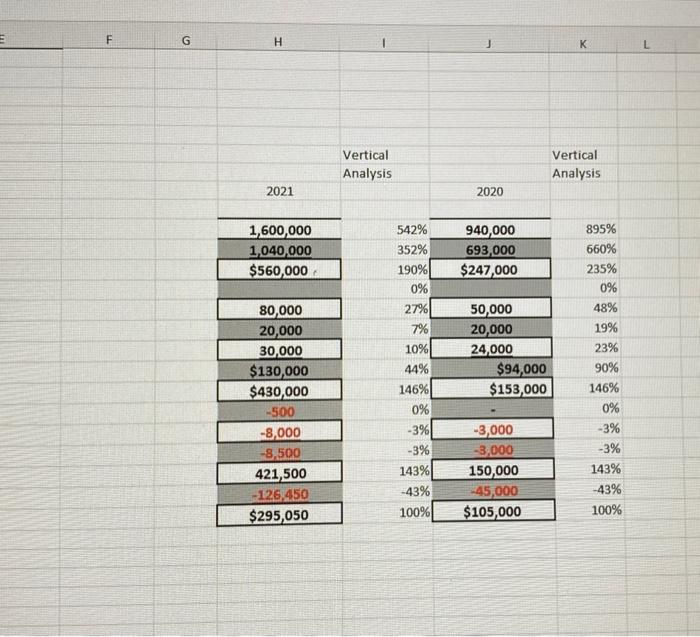
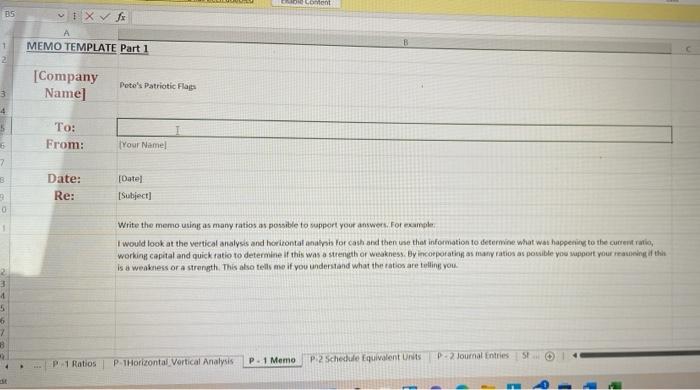
2 3 4. Working Capital Pete Paydirt's Patriotic Flags Solution Ratios Current Current Year Assets Liabilities Ratio 2021 429,700 270,000 159,700 Examp 2020 240,500 168,000 72,500 Year 2021 726,520 210,000 3.46 2020 380,000 200,000 1.90 5 6 7 Current Ratio 8 00 LO 9 10 Quick Ratio 11 2021 2020 526,520 260,000 210,000 2.51 200,000 1.30 12 2021 1,600,000 165,000 9.70 13 Account Receivable Tumover 14 15 Number of Days Sales in Receivables 2021 365 9.70 37.63 16 2021 1,040,000 100,000 10.40 17 Inventory Turnover 18 19 Number of Days Sales in Inventory 20 21 Ratio of Liabilities to S/E 2021 365 10.4 35.10 2021 2020 290,000 300,000 616,520 0.63 300,000 1.00 22 23 24 Return on Total Assets 2021 303,050 753,260 0.40 25 26 Return on SE 2021 295,050 458,260 0.64 27 28 Earnings per share 29 2021 2020 295,050 105,000 150,000 1.97 100,000 1.05 30 91 D G Horizontal Analysis for Balance Sheet 2021 2020 Cash Accounts Receivable, net Merchandise Inventory Prepaid Rent Total Current Assets 366,520 160,000 130,000 70,00 $226,520 90,000 170,000 70,000 50,000 $380,000 307 -65 865 40W 91% Equipment Less Accumulated Depreciation Equipment Total Property, Plant and Equipment 240,000 0000 $180,000 $906,520 260,000 10,000 $220,000 $600,000 8% 50% 18% 515 2021 2020 3 Comparative Balance Sheet 4 December 31, 2021 and 2020 5 6 Assets 7 Pete Paydi's Patriotic Flags 8 9 10 11 12 13 14 Property, Plant, and Equipment: 15 15 17 18 Total Assets 19 20 Liabilities and Stockholders' Equity 21 Current Liabilities 122 23 24 25 26 27 28 29 Long Term Liabilities 30 31 32 Total Long Term Liabilities 33 Total Liabilities 34 Stockholders Equity 35 36 37 38 39 Total Liabilities and Stockholders' Equity 90,000 55,000 75% Accounts Payable Dividends Payable Uneamed Revenue Salaries Payable Federal Income Taxes Payable Total Current Liabilities LON 20,000 70,000 30,000 $210,000 80.000 50.000 15,000 $200,000 100N 5 $100.000 80% Bond Payable Note Payable $20,000 $60,000 $80,000 $290,000 $100.000 $300.000 20 -35 Common Stork, $10 Par Paid in Capital in Excess of Par Retained Earnings Total Stockholders' Equity 150,000 15,000 451120 $616,520 $906,520 $100.000 10,000 $190,000 $300,000 $600,000 50% 50N 1585 100% 513 Chanta F G H K L Vertical Analysis Vertical Analysis 2021 2020 1,600,000 1,040,000 $560,000 940,000 693,000 $247,000 542% 352% 190% 0% 27% 7% 10% 44% 146% 0% 80,000 20,000 30,000 $130,000 $430,000 -500 -8,000 -8,500 421,500 -126,450 $295,050 50,000 20,000 24,000 $94,000 $153,000 895% 660% 235% 0% 48% 19% 23% 90% 146% 0% -3% -3% 143% -43% 100% -3% -3% 143% -43% 100% -3,000 -3,000 150,000 -45,000 $105,000 Comont DS x fo MEMO TEMPLATE Part 1 1 2 [Company Name] Pete's Patriotic Flags 3 4 5 To: From: 5 Your Name 7 B Date: Re: [Datei [Subject] 0 Write the memo using as many ratios as possible to support your answers. For example I would look at the vertical analysis and horizontal analysh for cash and then use that information to determine what was happening to the current ratio, working capital and quick ratio to determine if this was a strength or weakness. By incorporating as many ratios as pouible you support your atteing of this is a weakness or a strength This also tell me if you understand what the ratios are telling you. 2 4 5 6 7 3 P. 1 Memo P 2 Schedule Equivalent UNS P2 Journal Entries P.1 Ratios P T Horizontal Vertical Analysis 51 2 3 4. Working Capital Pete Paydirt's Patriotic Flags Solution Ratios Current Current Year Assets Liabilities Ratio 2021 429,700 270,000 159,700 Examp 2020 240,500 168,000 72,500 Year 2021 726,520 210,000 3.46 2020 380,000 200,000 1.90 5 6 7 Current Ratio 8 00 LO 9 10 Quick Ratio 11 2021 2020 526,520 260,000 210,000 2.51 200,000 1.30 12 2021 1,600,000 165,000 9.70 13 Account Receivable Tumover 14 15 Number of Days Sales in Receivables 2021 365 9.70 37.63 16 2021 1,040,000 100,000 10.40 17 Inventory Turnover 18 19 Number of Days Sales in Inventory 20 21 Ratio of Liabilities to S/E 2021 365 10.4 35.10 2021 2020 290,000 300,000 616,520 0.63 300,000 1.00 22 23 24 Return on Total Assets 2021 303,050 753,260 0.40 25 26 Return on SE 2021 295,050 458,260 0.64 27 28 Earnings per share 29 2021 2020 295,050 105,000 150,000 1.97 100,000 1.05 30 91 D G Horizontal Analysis for Balance Sheet 2021 2020 Cash Accounts Receivable, net Merchandise Inventory Prepaid Rent Total Current Assets 366,520 160,000 130,000 70,00 $226,520 90,000 170,000 70,000 50,000 $380,000 307 -65 865 40W 91% Equipment Less Accumulated Depreciation Equipment Total Property, Plant and Equipment 240,000 0000 $180,000 $906,520 260,000 10,000 $220,000 $600,000 8% 50% 18% 515 2021 2020 3 Comparative Balance Sheet 4 December 31, 2021 and 2020 5 6 Assets 7 Pete Paydi's Patriotic Flags 8 9 10 11 12 13 14 Property, Plant, and Equipment: 15 15 17 18 Total Assets 19 20 Liabilities and Stockholders' Equity 21 Current Liabilities 122 23 24 25 26 27 28 29 Long Term Liabilities 30 31 32 Total Long Term Liabilities 33 Total Liabilities 34 Stockholders Equity 35 36 37 38 39 Total Liabilities and Stockholders' Equity 90,000 55,000 75% Accounts Payable Dividends Payable Uneamed Revenue Salaries Payable Federal Income Taxes Payable Total Current Liabilities LON 20,000 70,000 30,000 $210,000 80.000 50.000 15,000 $200,000 100N 5 $100.000 80% Bond Payable Note Payable $20,000 $60,000 $80,000 $290,000 $100.000 $300.000 20 -35 Common Stork, $10 Par Paid in Capital in Excess of Par Retained Earnings Total Stockholders' Equity 150,000 15,000 451120 $616,520 $906,520 $100.000 10,000 $190,000 $300,000 $600,000 50% 50N 1585 100% 513 Chanta F G H K L Vertical Analysis Vertical Analysis 2021 2020 1,600,000 1,040,000 $560,000 940,000 693,000 $247,000 542% 352% 190% 0% 27% 7% 10% 44% 146% 0% 80,000 20,000 30,000 $130,000 $430,000 -500 -8,000 -8,500 421,500 -126,450 $295,050 50,000 20,000 24,000 $94,000 $153,000 895% 660% 235% 0% 48% 19% 23% 90% 146% 0% -3% -3% 143% -43% 100% -3% -3% 143% -43% 100% -3,000 -3,000 150,000 -45,000 $105,000 Comont DS x fo MEMO TEMPLATE Part 1 1 2 [Company Name] Pete's Patriotic Flags 3 4 5 To: From: 5 Your Name 7 B Date: Re: [Datei [Subject] 0 Write the memo using as many ratios as possible to support your answers. For example I would look at the vertical analysis and horizontal analysh for cash and then use that information to determine what was happening to the current ratio, working capital and quick ratio to determine if this was a strength or weakness. By incorporating as many ratios as pouible you support your atteing of this is a weakness or a strength This also tell me if you understand what the ratios are telling you. 2 4 5 6 7 3 P. 1 Memo P 2 Schedule Equivalent UNS P2 Journal Entries P.1 Ratios P T Horizontal Vertical Analysis 51
Step by Step Solution
There are 3 Steps involved in it

Get step-by-step solutions from verified subject matter experts