

Question: ASAPPPP PLEASE . College ALGEBRA TEST The following data represent Candy Bar Weight, x Calories, y Candy Bar Weight, x Calories, y the weight (in
ASAPPPP PLEASE . College ALGEBRA TEST
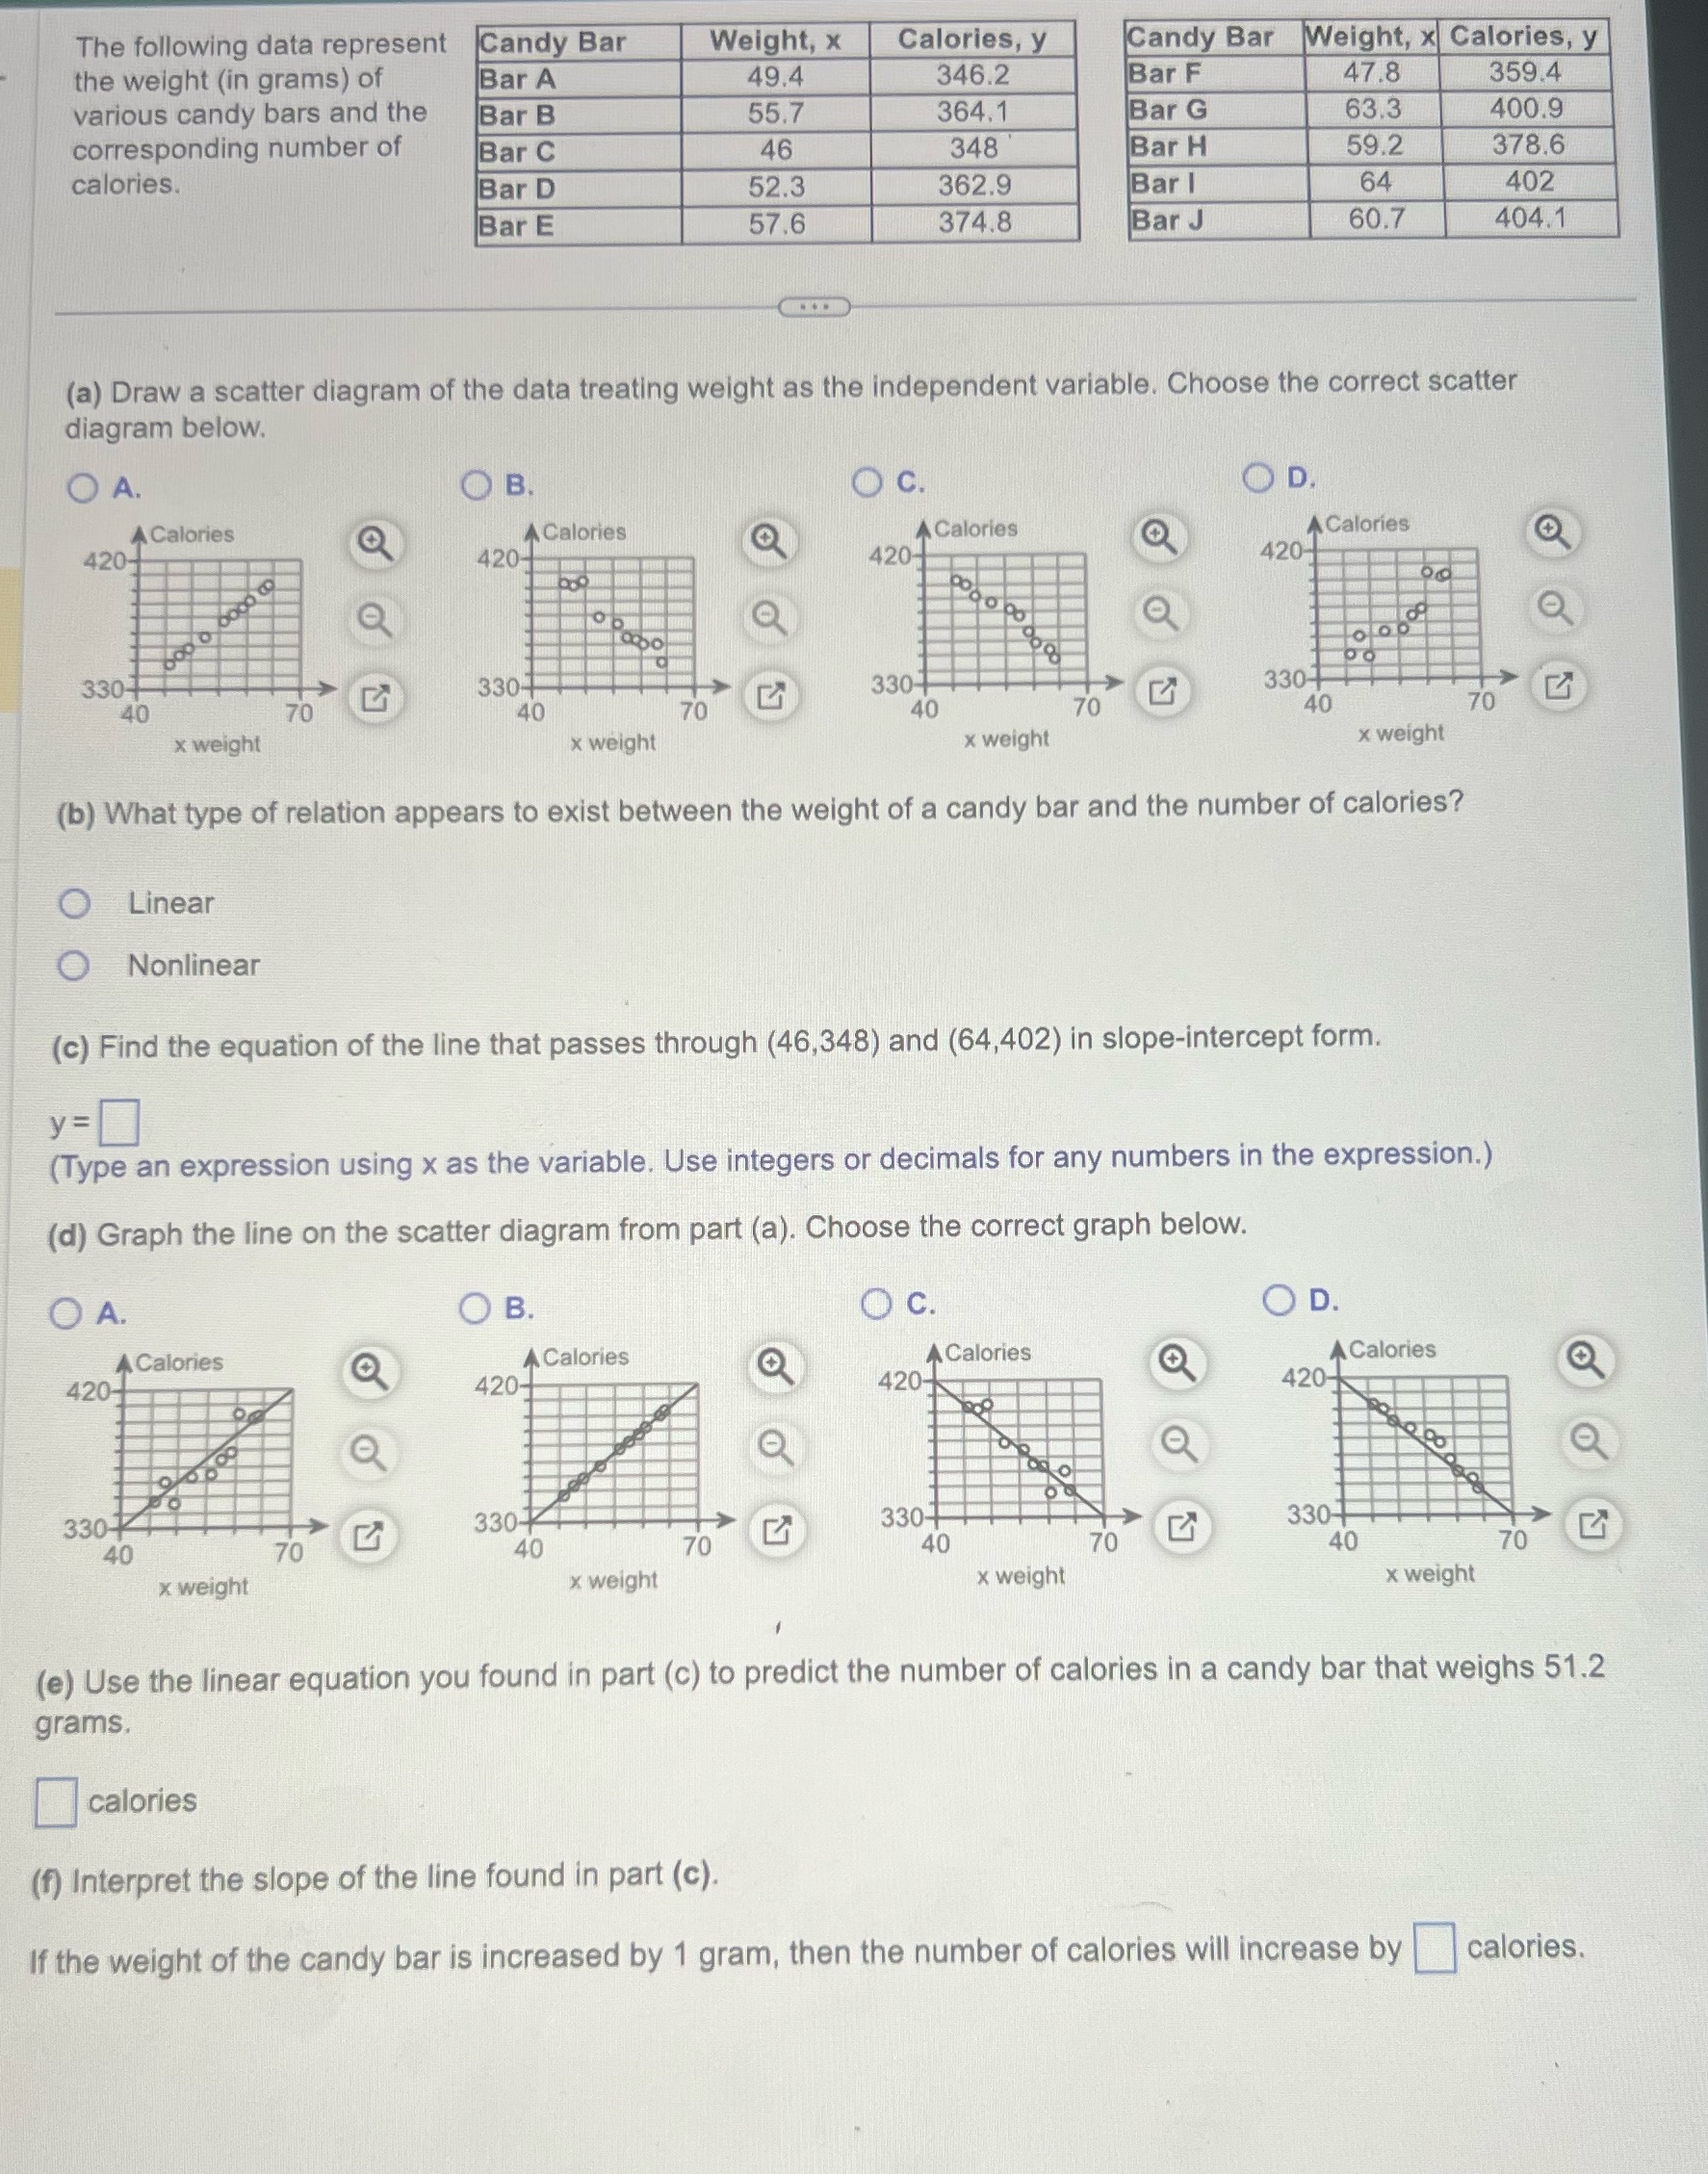
The following data represent Candy Bar Weight, x Calories, y Candy Bar Weight, x Calories, y the weight (in grams) of Bar A 49.4 346.2 Bar F 47.8 359.4 various candy bars and the Bar B 55.7 364.1 Bar G 63.3 400.9 corresponding number of Bar C 46 348 Bar H 59.2 378.6 calories. Bar D 52.3 362.9 Bar I 64 402 Bar E 57.6 374.8 Bar J 60.7 404.1 (a) Draw a scatter diagram of the data treating weight as the independent variable. Choose the correct scatter diagram below. O A. O B O c. OD. A Calories A Calories A Calories A Calories 420- 420- 420- 420- 330- 330-+ 330- 330- 40 40 x weight x weight x weight x weight (b) What type of relation appears to exist between the weight of a candy bar and the number of calories? Linear O Nonlinear (c) Find the equation of the line that passes through (46,348) and (64,402) in slope-intercept form. y =] (Type an expression using x as the variable. Use integers or decimals for any numbers in the expression.) (d) Graph the line on the scatter diagram from part (a). Choose the correct graph below. O A. O B. O c. OD. A Calories A Calories A Calories A Calories 420- 420- 420- 420- 330- 330- 330- 330 40 70 40 70 40 70 40 70 x weight x weight x weight x weight (e) Use the linear equation you found in part (c) to predict the number of calories in a candy bar that weighs 51.2 grams. calories (f) Interpret the slope of the line found in part (c). If the weight of the candy bar is increased by 1 gram, then the number of calories will increase by calories
Step by Step Solution
There are 3 Steps involved in it

Get step-by-step solutions from verified subject matter experts