

Question: ask if there is any additional info I need to add thank you for your assistance. This data is from the drought that hit the
ask if there is any additional info I need to add thank you for your assistance.
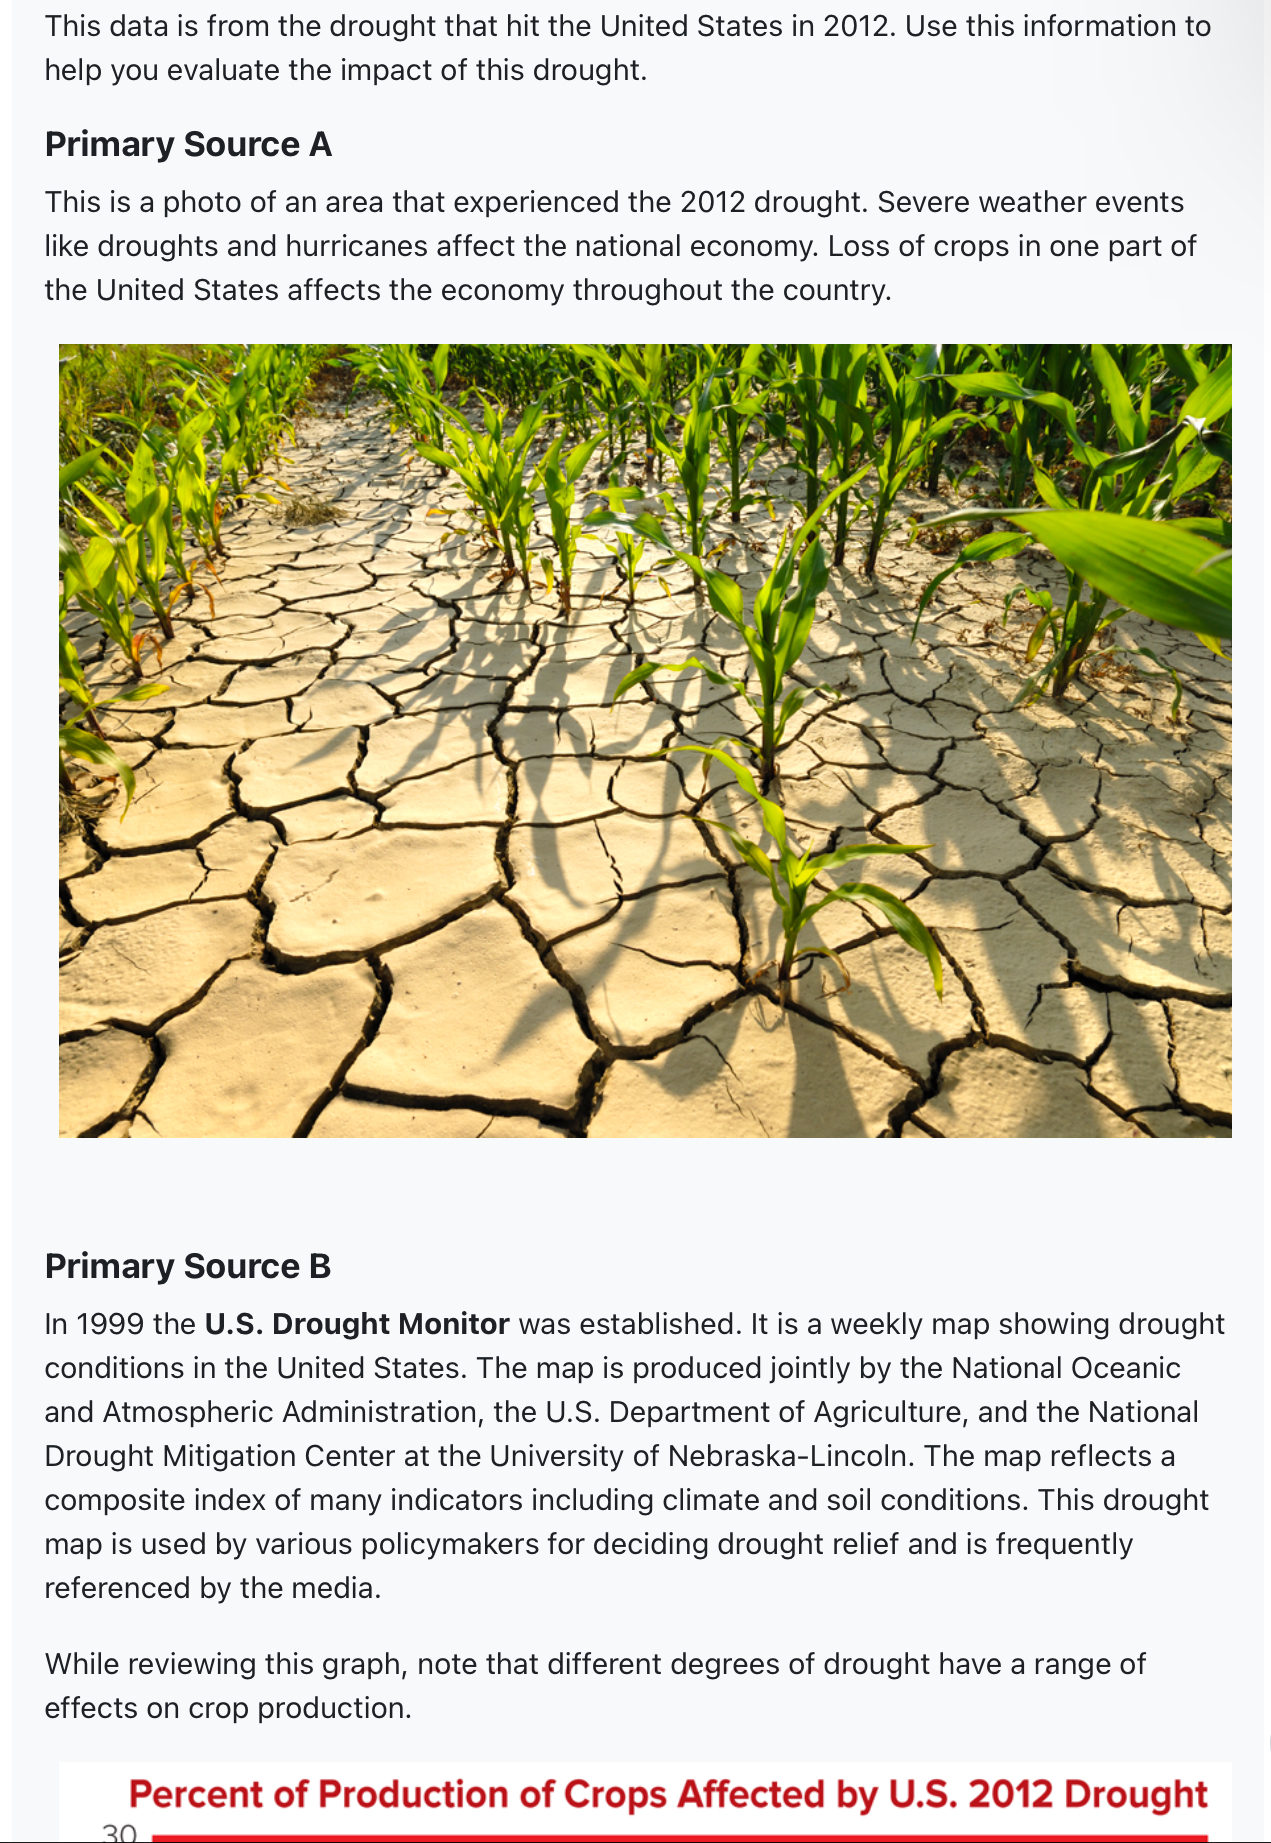
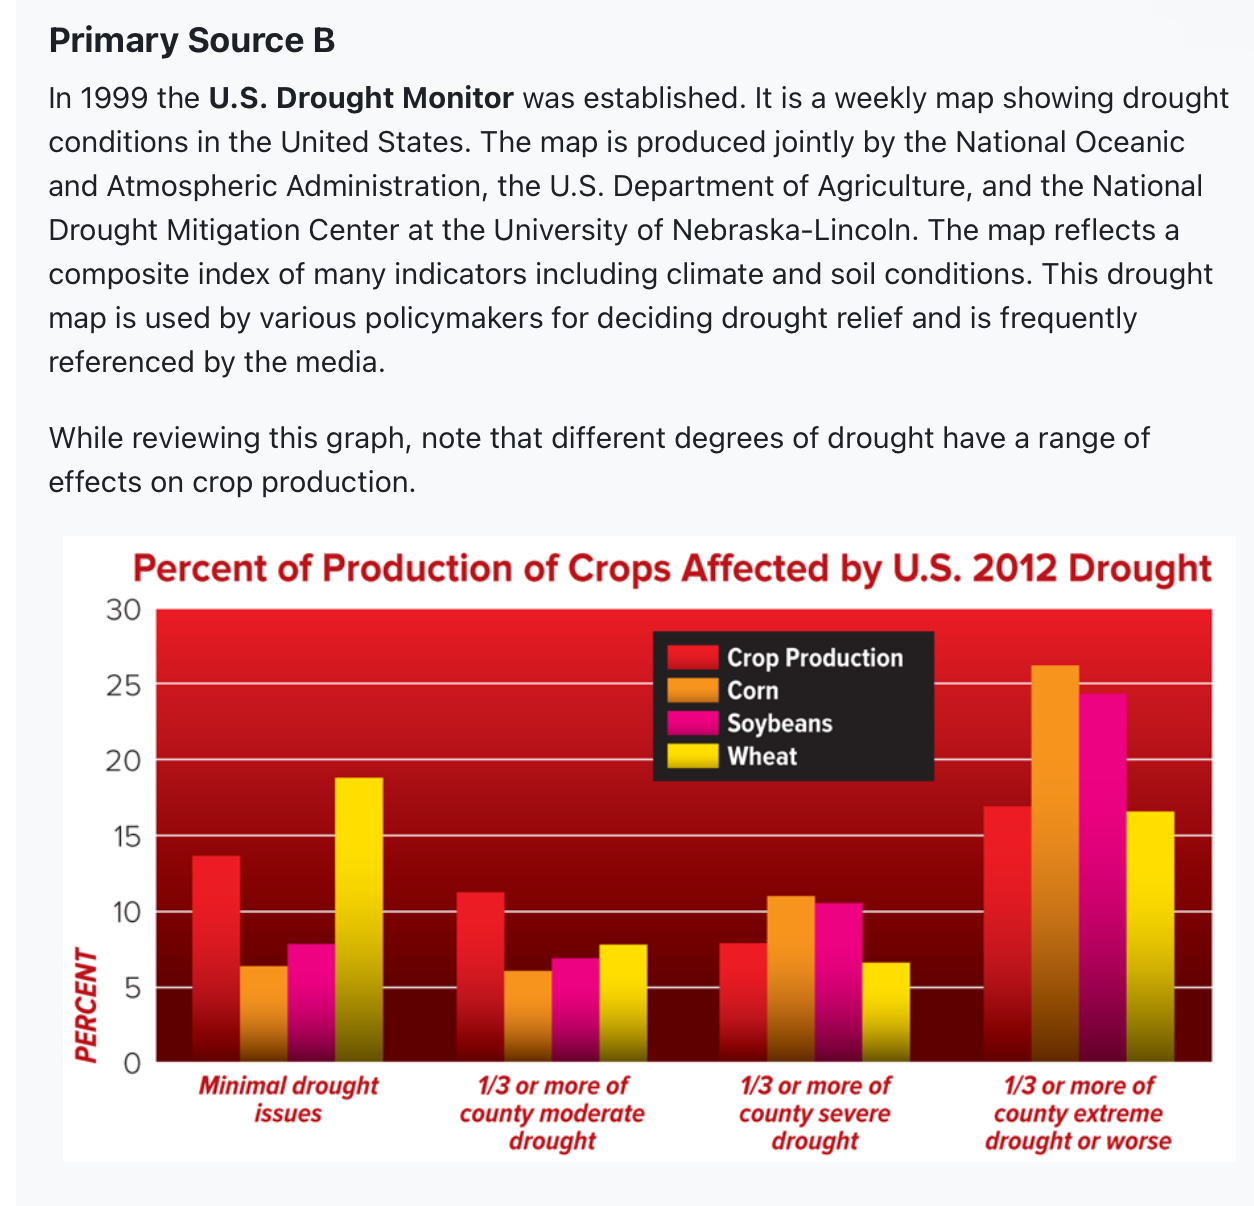
This data is from the drought that hit the United States in 2012. Use this information to help you evaluate the impact of this drought. Primary Source A This is a photo of an area that experienced the 2012 drought. Severe weather events like droughts and hurricanes affect the national economy. Loss of crops in one part of the United States affects the economy throughout the country. Primary Source B In 1999 the U.S. Drought Monitor was established. It is a weekly map showing drought conditions in the United States. The map is produced jointly by the National Oceanic and Atmospheric Administration, the U.S. Department of Agriculture, and the National Drought Mitigation Center at the University of Nebraska-Lincoln. The map reflects a composite index of many indicators including climate and soil conditions. This drought map is used by various policymakers for deciding drought relief and is frequently referenced by the media. While reviewing this graph, note that different degrees of drought have a range of effects on crop production. 30 Percent of Production of Crops Affected by U.S. 2012 Drought
Step by Step Solution
There are 3 Steps involved in it

Get step-by-step solutions from verified subject matter experts