

Question: Asking about this question below. if you need the number data, please follow the instruction in the question to download the number and solve it
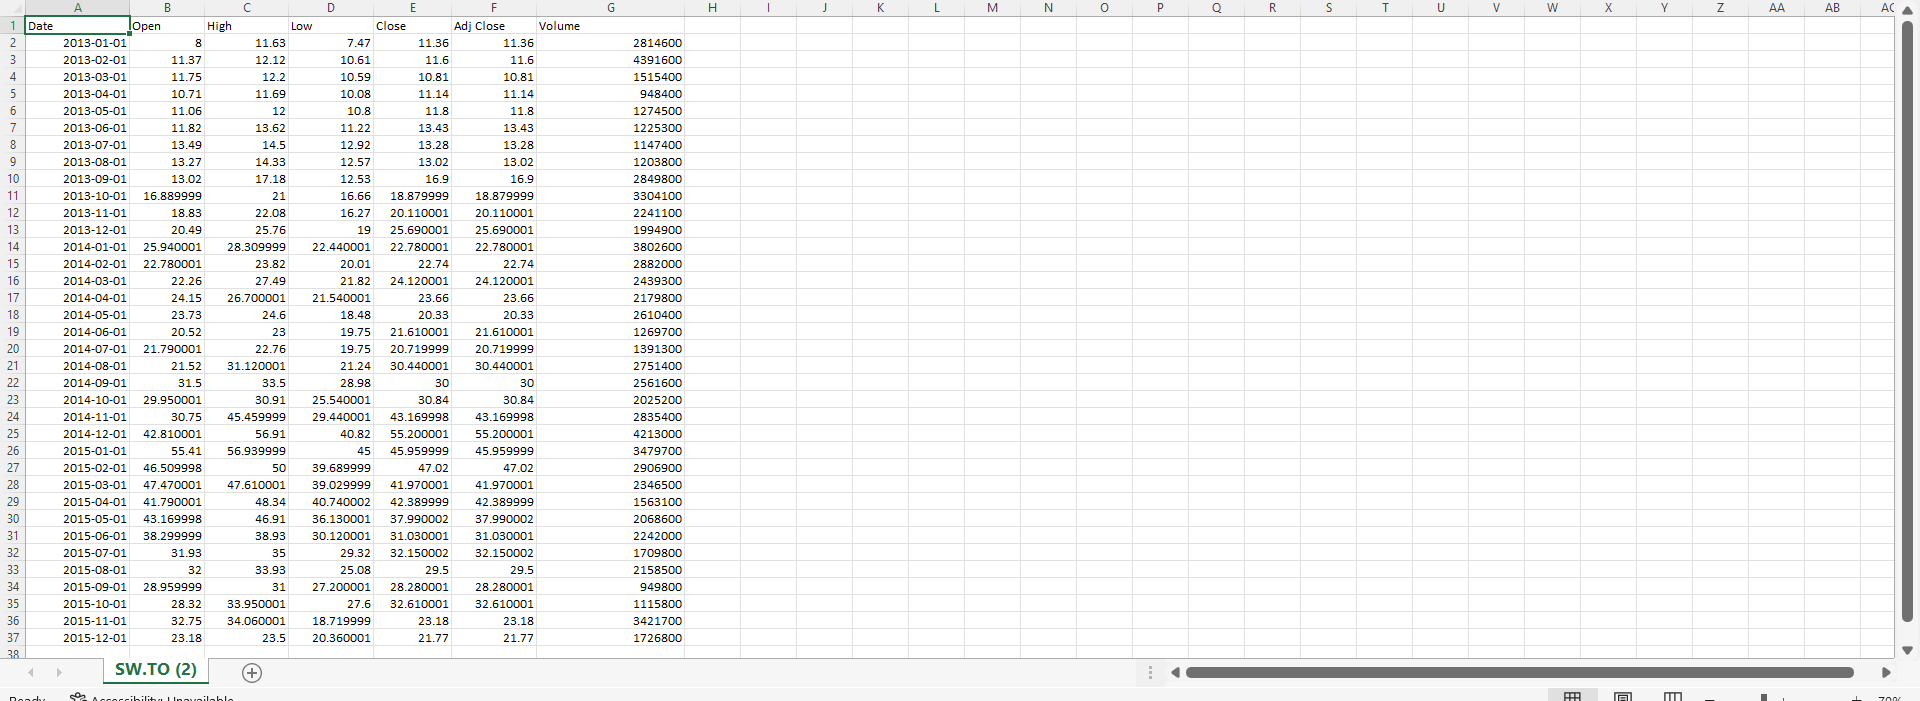
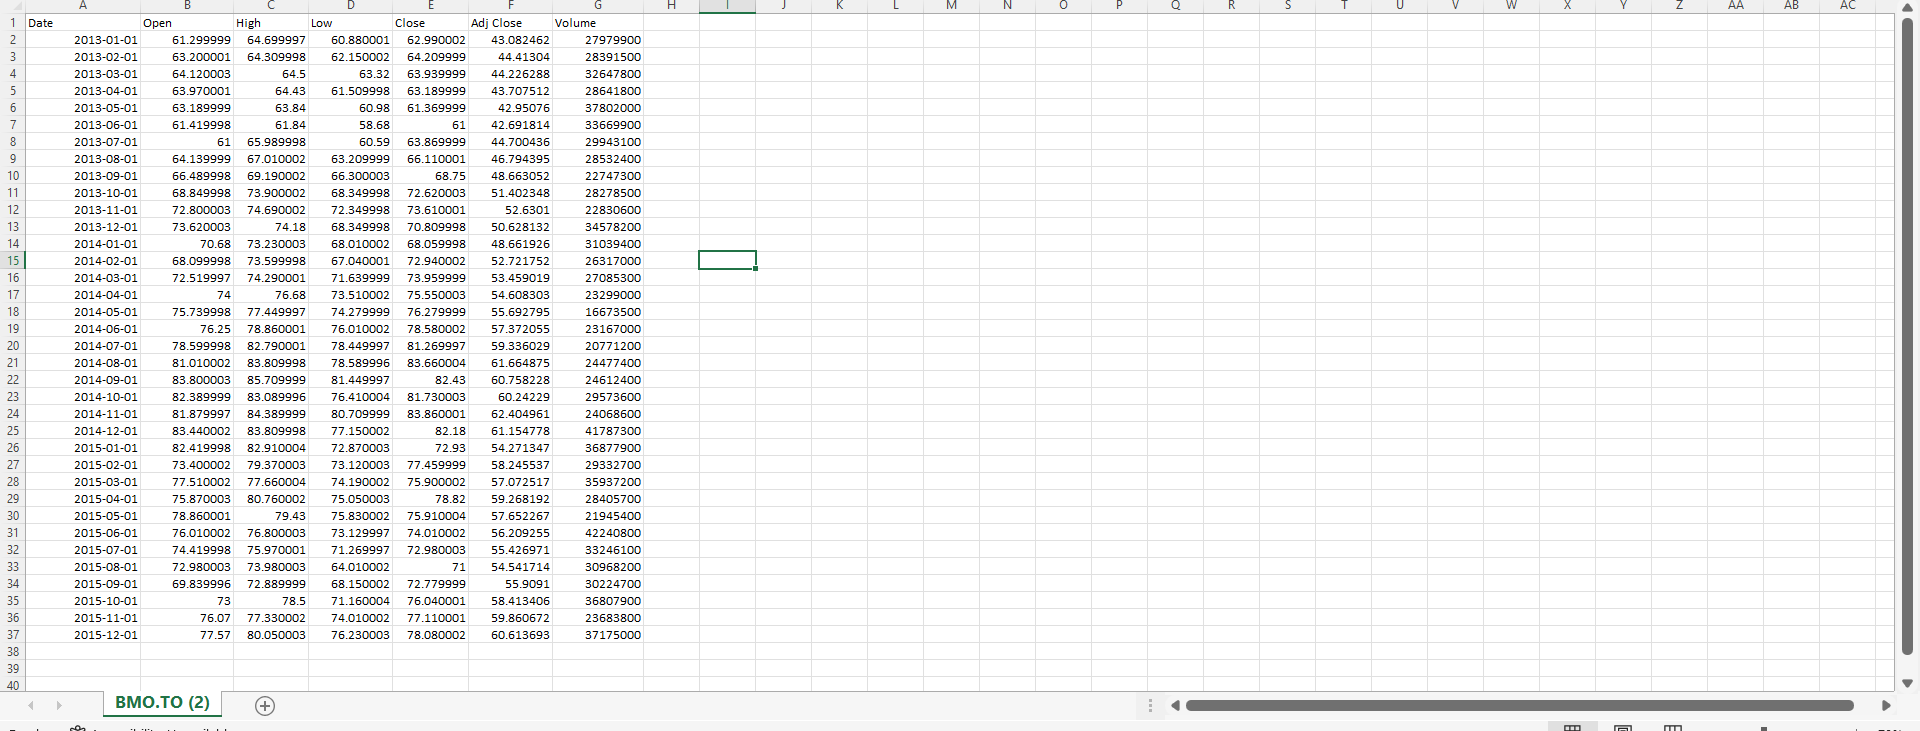
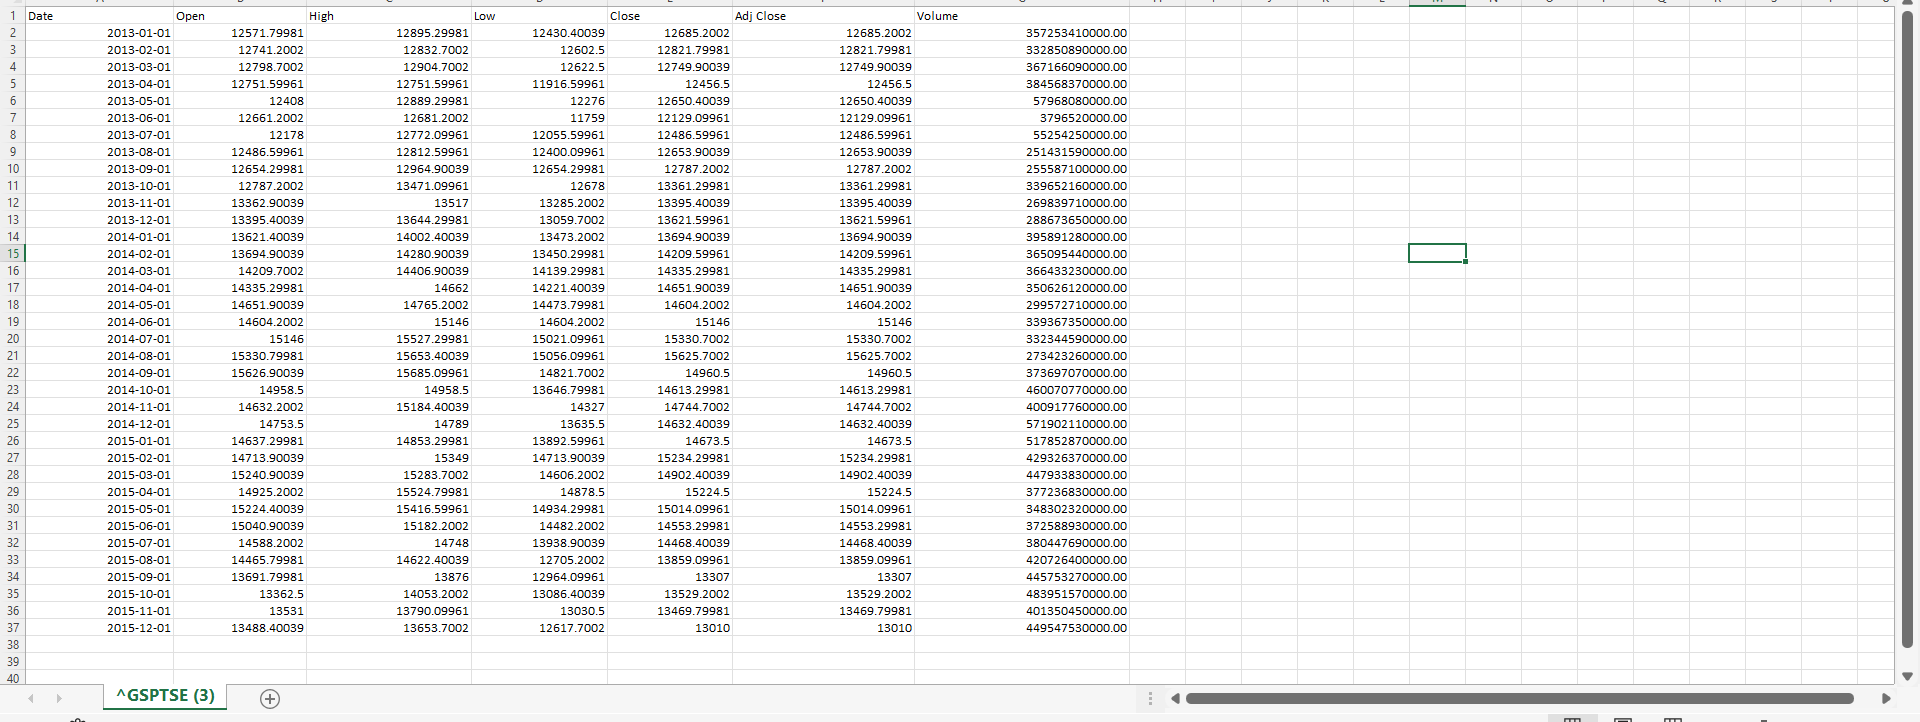
Asking about this question below. if you need the number data, please follow the instruction in the question to download the number and solve it for me because i can not add the excel files here. I also give you the pictures to compare is that you are downloading right data numbers or wrong one. and please give me the detail explanations and proper answers in Excel. Thanks so much!
Equation 11.8 is:?p=?1?1+?2?2+...+?n?n

Step by Step Solution
There are 3 Steps involved in it
1 Expert Approved Answer
Step: 1 Unlock

Question Has Been Solved by an Expert!
Get step-by-step solutions from verified subject matter experts
Step: 2 Unlock
Step: 3 Unlock