

Question: Asking for help with this again. The Conch Cafe, located in Gulf Shores, Alabama. features casual lunches with a great view of the Gulf of
Asking for help with this again.
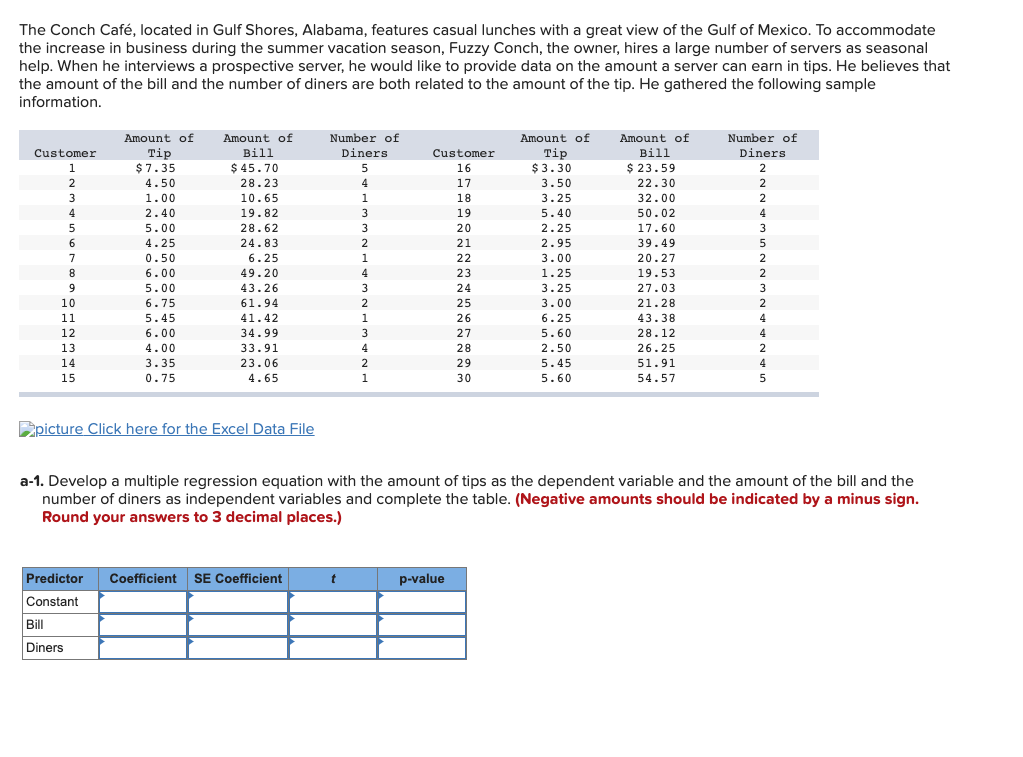
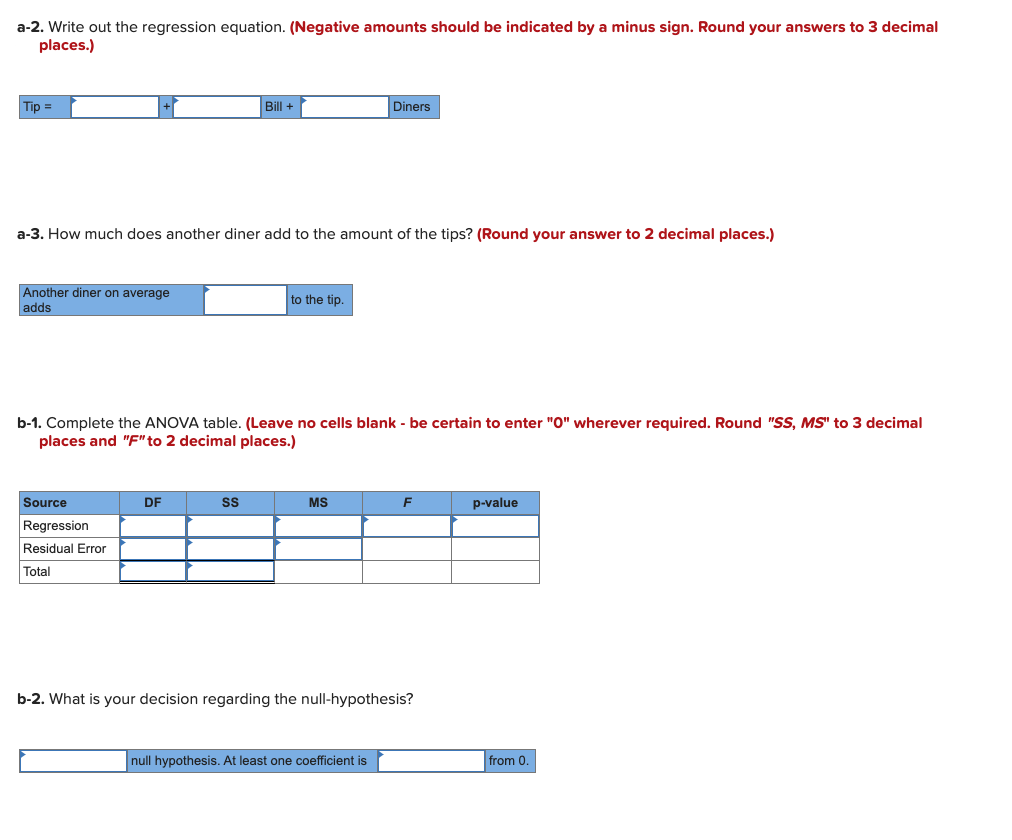
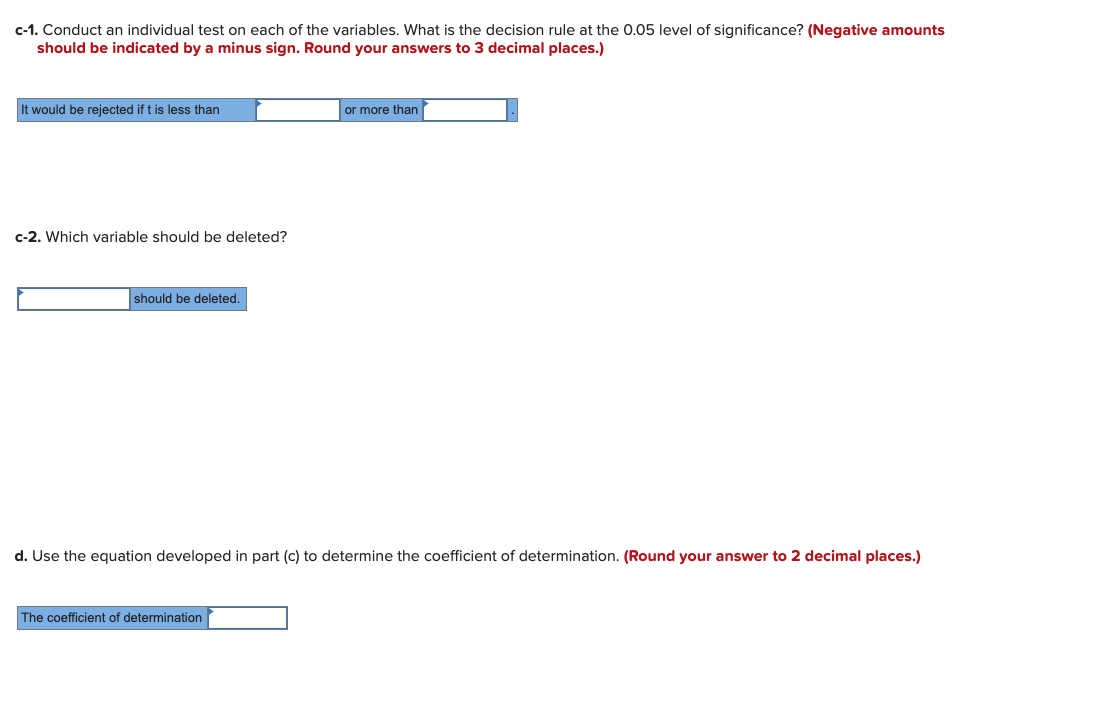
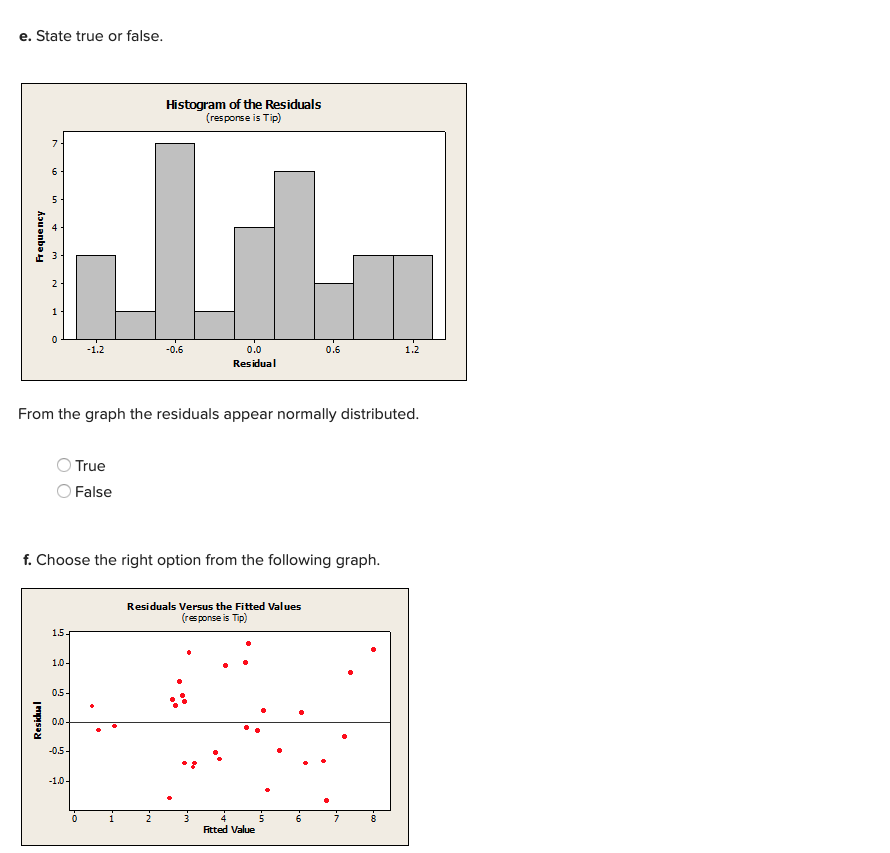
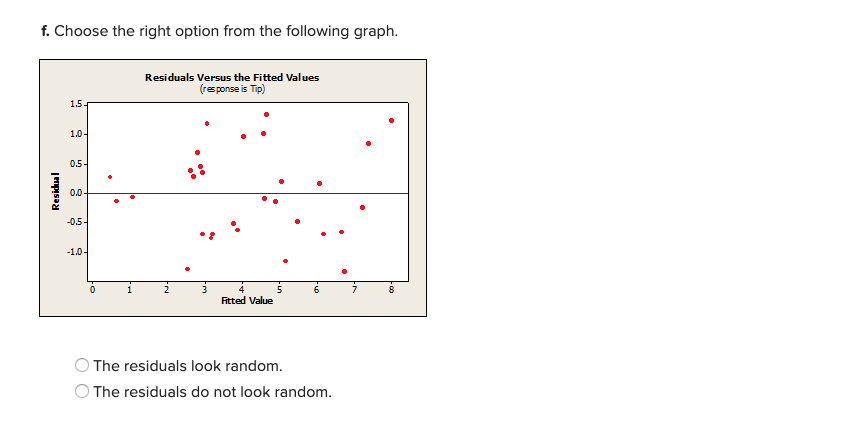
The Conch Cafe, located in Gulf Shores, Alabama. features casual lunches with a great view of the Gulf of Mexico. To accommodate the increase in business during the summer vacation season, Fuzzy Conch, the owner, hires a large number of servers as seasonal help. When he interviews a prospective server. he would like to provide data on the amount a server can earn in tips. He believes that the amount of the bill and the number of diners are both related to the amount of the tip. He gathered the following sample information. Amount of Amount of lumber of Amount of Amount of lumber of Customer 'l'ip Bill Dinars Customer Tip Bill Dinars 1 $7.35 $45.70 5 16 $3.30 $23.59 2 2 4.50 20.23 4 1.7 3.50 22.30 2 3 1.00 10.65 1 18 3.25 32.00 2 4 2.40 19.92 3 19 5.40 50.02 4 5 5.00 20.62 3 20 2.25 17.60 3 6 4.25 24.93 2 21 2.95 39.49 5 7 0.50 6.25 1 22 3.00 20.27 2 8 6.00 49.20 4 23 1.25 19.53 2 9 5.00 43.26 3 24 3.25 27.03 3 10 6.75 61.94 2 25 3.00 21.23 2 11 5.45 41.42 1 26 6.25 43.33 4 12 6.00 34.99 3 27 5.60 23.12 4 13 4.00 33.91 4 28 2.50 26.25 2 14 3.35 23.06 2 29 5.45 51.91 4 15 0.75 4.65 1 30 5.60 54.57 5 Epicture Click here for the Excel Data File a-1. Develop a multiple regression equation with the amount of tips as the dependent variable and the amount of the bill and the number of diners as independent variables and complete the table. {Negative amounts should be indicated by a minus sign. Round your answers to 3 decimal places.) a-2. Write out the regression equation. {Negative amounts should be indicated by a minus sign. Round your answers to 3 decimal places} -:I:-:- a-3. How much does another diner add to the amount of the tips? {Round your answer to 2 decimal placesJ b-1. Complete the ANOVA table. {Leave no cells blank - be certain to enter '0\" wherever required. Round \"55. M5" to 3 decimal places and I\"F"to 2 decimal places.) Regression Residual Error b-2. What is your decision regarding the null-hypothesis? :: c-1. Conduct an individual test on each of the variables. What is the decision rule at the 0.05 level of significance? (Negative amounts should be indicated by a minus sign. Round your answers to 3 decimal places.) It would be rejected if t is less than or more than c-2. Which variable should be deleted? should be deleted. d. Use the equation developed in part (c) to determine the coefficient of determination. (Round your answer to 2 decimal places.) The coefficient of determinatione. State true or false. Histogram of the Residuals ( response is Tip on Frequency -1.2 -0.6 0.0 0.6 1.2 Residual From the graph the residuals appear normally distributed. O True O False f. Choose the right option from the following graph. Residuals Versus the Fitted Values (response is Tip) 1.5 1.0 0.5 Residual 0.0 0.5 -1.0. 2 6 7 Fitted Value 5f. Choose the right option from the following graph. Residuals Versus the Fitted Values (response is Tip) 1.5- 1.0 - 0.5- Residual D.0- -0.5- -1.0 - W. 4 in- Fitted Value O The residuals look random. O The residuals do not look random
Step by Step Solution
There are 3 Steps involved in it

Get step-by-step solutions from verified subject matter experts