

Question: Asset pricing model using graph: Stock Beta Standard Deviation Expected Return DET 0.7 AIL 1.0 INO 1.6 25% 38% 34% 8.0% 10.0% 13.5% An analyst
Asset pricing model using graph:
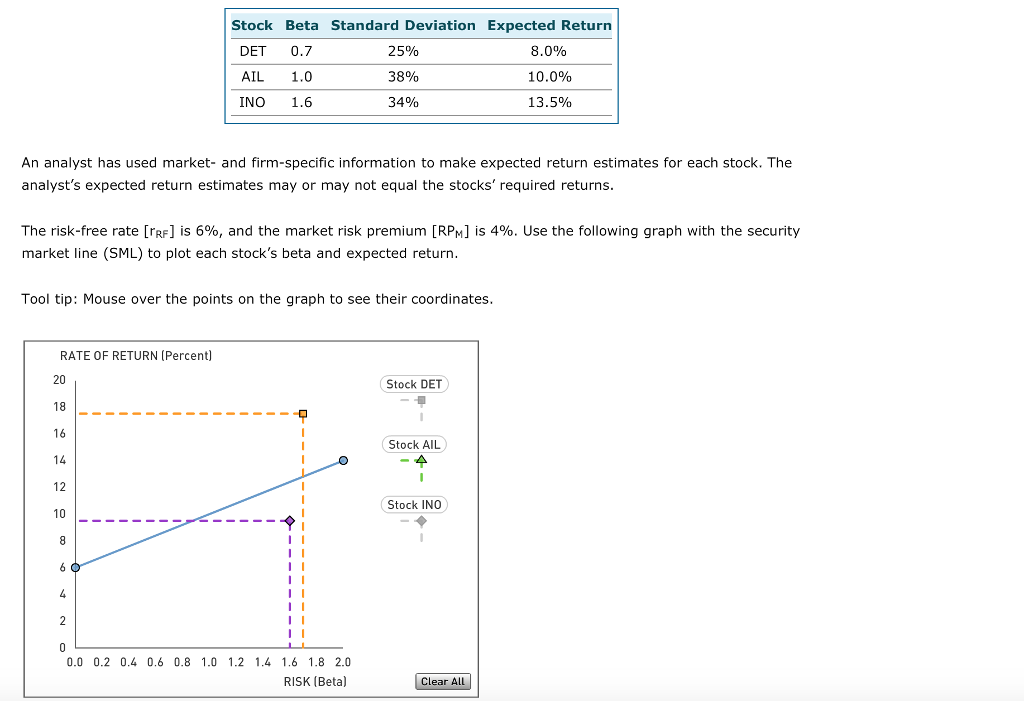
Stock Beta Standard Deviation Expected Return DET 0.7 AIL 1.0 INO 1.6 25% 38% 34% 8.0% 10.0% 13.5% An analyst has used market- and firm-specific information to make expected return estimates for each stock. The analyst's expected return estimates may or may not equal the stocks' required returns The risk-free rate [Rr] is 6%, and the market risk premium [RPm] is 4%. Use the following graph with the security market line (SML) to plot each stock's beta and expected return Tool tip: Mouse over the points on the graph to see their coordinates RATE OF RETURN (Percent) 20 Stock DET 16 14 12 Stock AIL Stock INO 0.0 0.2 0.4 0.6 0.8 1.0 1.2 14 1.6 1.8 2.0 RISK (Beta) Clear AlL
Step by Step Solution
There are 3 Steps involved in it

Get step-by-step solutions from verified subject matter experts