

Question: ASSETS Current Assets Cash A/R Merch. Invty. Total Current Assets Non-Current Assets PPE Total Non-Current Assets TOTAL ASSETS LIABILITIES & SE Current Liabilities Accounts
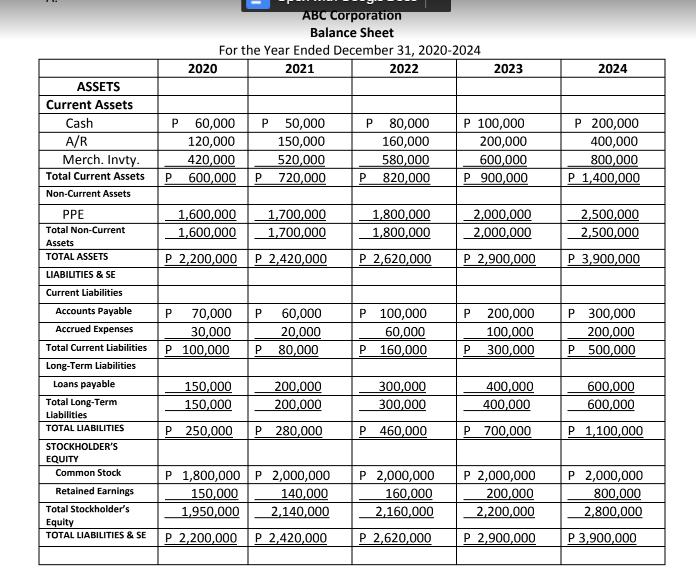
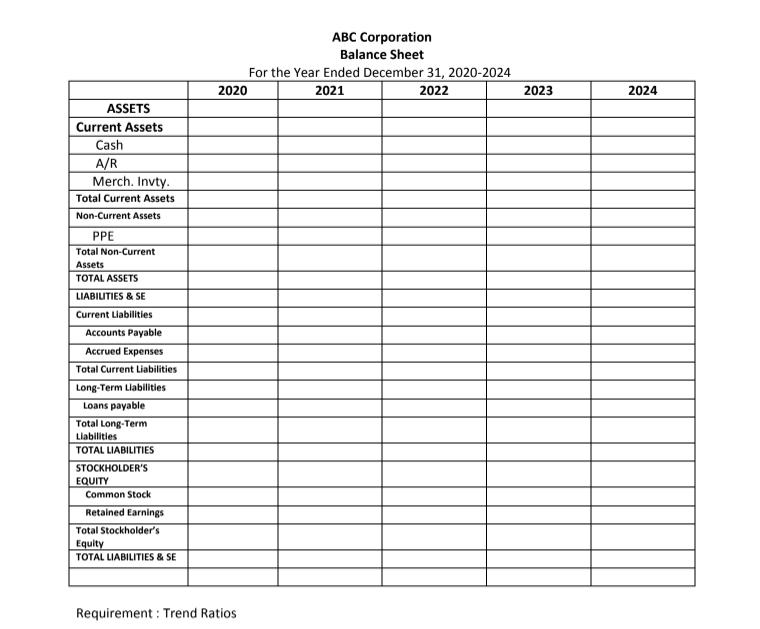
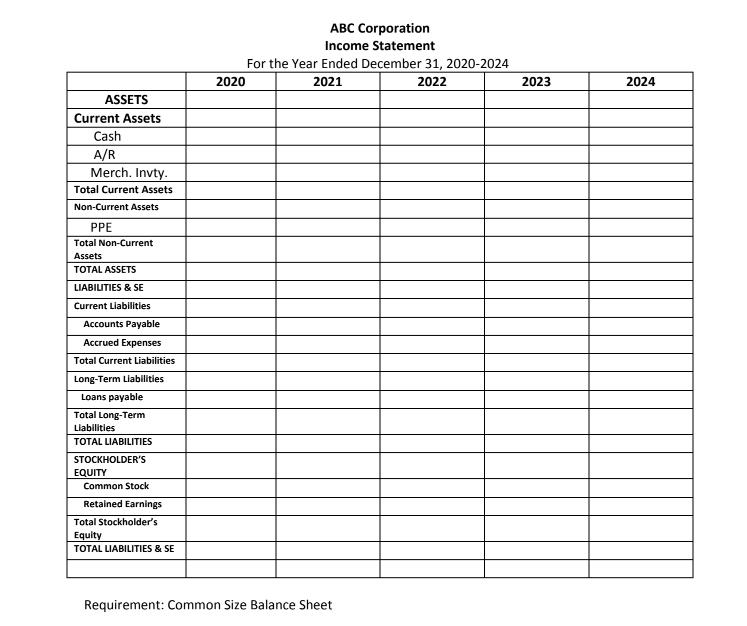
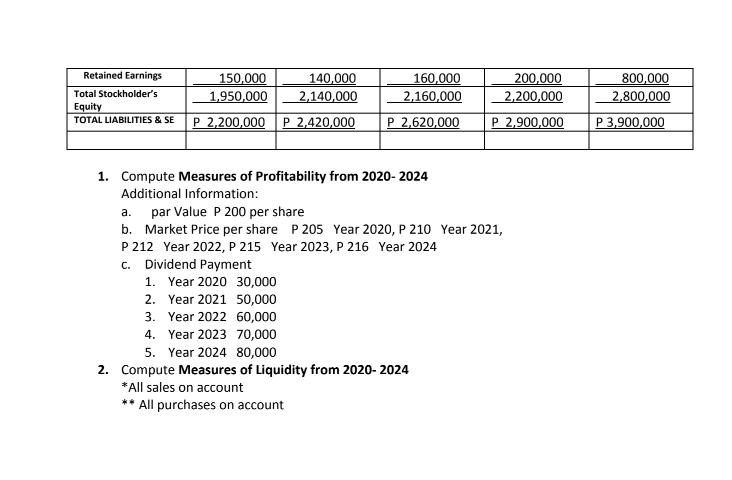
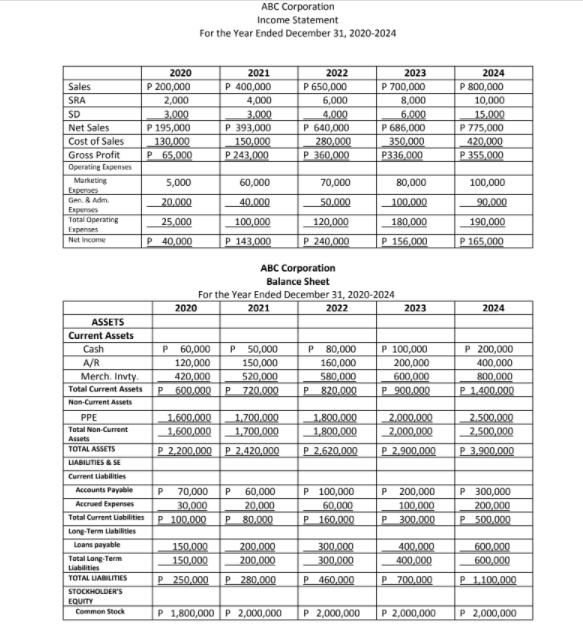
ASSETS Current Assets Cash A/R Merch. Invty. Total Current Assets Non-Current Assets PPE Total Non-Current Assets TOTAL ASSETS LIABILITIES & SE Current Liabilities Accounts Payable Accrued Expenses Long-Term Liabilities Loans payable Total Long-Term Liabilities TOTAL LIABILITIES STOCKHOLDER'S EQUITY Common Stock Retained Earnings 2020 Total Current Liabilities P 100,000 Total Stockholder's Equity TOTAL LIABILITIES & SE For the Year Ended December 31, 2020-2024 2021 2022 ABC Corporation Balance Sheet P 60,000 120,000 420,000 P 50,000 150,000 520,000 P 600,000 P 720,000 1,600,000 1,700,000 1,700,000 1,600,000 P 2,200,000 P 2,420,000 P 70,000 P 30,000 60,000 20,000 80,000 150,000 200,000 150,000 200,000 P 250,000 P 280,000 P 1,800,000 P 2,000,000 150,000 1,950,000 140,000 2,140,000 P 2,200,000 P 2,420,000 80,000 160,000 580,000 P 820,000 P 1,800,000 1,800,000 P 2,620,000 P 100,000 60,000 P 160,000 300,000 300,000 P 460,000 P 2,000,000 160,000 2,160,000 P 2,620,000 2023 P 100,000 200,000 600,000 P 900,000 2,000,000 2,000,000 P 2,900,000 P 200,000 100,000 300,000 P 400,000 400,000 P 700,000 P 2,000,000 200,000 2,200,000 P 2,900,000 2024 P 200,000 400,000 800,000 P 1,400,000 2,500,000 2,500,000 P 3,900,000 P 300,000 200,000 P 500,000 600,000 600,000 P 1,100,000 P 2,000,000 800,000 2,800,000 P 3,900,000 ASSETS Current Assets Cash A/R Merch. Invty. Total Current Assets Non-Current Assets PPE Total Non-Current Assets TOTAL ASSETS LIABILITIES & SE Current Liabilities Accounts Payable Accrued Expenses Total Current Liabilities Long-Term Liabilities Loans payable Total Long-Term Liabilities TOTAL LIABILITIES STOCKHOLDER'S EQUITY Common Stock Retained Earnings Total Stockholder's Equity TOTAL LIABILITIES & SE 2020 Requirement: Trend Ratios: ABC Corporation Balance Sheet For the Year Ended December 31, 2020-2024 2021 2022 2023 2024 ASSETS Current Assets Cash A/R Merch. Invty. Total Current Assets Non-Current Assets PPE Total Non-Current Assets TOTAL ASSETS LIABILITIES & SE Current Liabilities Accounts Payable Accrued Expenses Total Current Liabilities Long-Term Liabilities Loans payable Total Long-Term Liabilities TOTAL LIABILITIES STOCKHOLDER'S EQUITY Common Stock Retained Earnings Total Stockholder's Equity TOTAL LIABILITIES & SE 2020 ABC Corporation Income Statement For the Year Ended December 31, 2020-2024 2021 2022 Requirement: Common Size Balance Sheet 2023 2024 Retained Earnings Total Stockholder's Equity TOTAL LIABILITIES & SE 150,000 1,950,000 140,000 2,140,000 P 2,200,000 P 2,420,000 160,000 2,160,000 P 2,620,000 1. Compute Measures of Profitability from 2020-2024 Additional Information: a. par Value P 200 per share b. Market Price per share P 205 Year 2020, P 210 Year 2021, P 212 Year 2022, P 215 Year 2023, P 216 Year 2024 c. Dividend Payment 1. Year 2020 30,000 2. Year 2021 50,000 60,000 3. Year 2022 4. Year 2023 70,000 5. Year 2024 80,000 2. Compute Measures of Liquidity from 2020-2024 *All sales on account ** All purchases on account 200,000 2,200,000 P 2,900,000 800,000 2,800,000 P 3,900,000 Sales SRA SD Net Sales Cost of Sales Gross Profit Operating Expenses Marketing Expenses Gen, & Adm Expenses Total Operating Expenses Net Income ASSETS Current Assets Cash A/R Merch. Invty. Total Current Assets Non-Current Assets PPE Total Non-Current Assets TOTAL ASSETS LIABILITIES & SE Current Liabilities Accounts Payable Accrued Expenses Total Current Liabilities Long-Term Liabilities Loans payable Total Long-Term Liabilities TOTAL LIABILITIES STOCKHOLDER'S EQUITY Common Stock 2020 P 200,000 2,000 3.000 P 195,000 130,000 P 65.000 5,000 20,000 25,000 P 40,000 2020 ABC Corporation Income Statement For the Year Ended December 31, 2020-2024 2021 P 400,000 4,000 3.000 1.600.000 1,600,000 P 2,200,000 P 393,000 150,000 P 243,000 P 70,000 30,000 P 100.000 60,000 40,000 100,000 P 143,000 P 60,000 120,000 420,000 P 50,000 150,000 520,000 P 600,000 P 720.000 1.700.000 1,700,000 P. 2,420,000 P ABC Corporation Balance Sheet 60,000 20,000 P 80.000 For the Year Ended December 31, 2020-2024 2021 2022 2022 P 650,000 6,000 4,000 P 640,000 280,000 P 360,000 150,000 150,000 200.000 200,000 P 250,000 P 280,000 70,000 50,000 P 1,800,000 P 2,000,000 120,000 P 240,000 1,800,000 1,800,000 P 2,620,000 P 100,000 60,000 P 160,000 2023 P 700,000 8,000 6.000 300.000 300,000 P 460.000 P 686,000 350,000 P336.000 P 80,000 160,000 580,000 P 100,000 200,000 600,000 P 820.000 P 900.000 P 2,000,000 80,000 100,000 180,000 P 156,000 2023 2,000,000 2,000,000 P 2,900,000 P 200,000 100,000 P 300.000 400,000 400,000 P 700,000 P 2,000,000 2024 P 800,000 10,000 15,000 P 775,000 420,000 P 355.000 100,000 90,000 190,000 P 165,000 2024 P 200,000 400,000 800,000 P 1.400.000 2.500.000 2,500,000 P 3,900,000 P 300,000 200,000 P 500,000 600,000 600,000 P 1,100,000 P 2,000,000
Step by Step Solution
3.44 Rating (163 Votes )
There are 3 Steps involved in it
Based on the provided financial statements and additional information you want to compute measures of profitability and liquidity for ABC Corporation ... View full answer

Get step-by-step solutions from verified subject matter experts