

Question: Assets FIELDS INCORPORATED Comparative Balance Sheets June 30, 2019 and 2018 Cash Accounts receivable, net Prepaid expenses Inventory Total current assets. Equipment Accumulated depreciation-Equipment
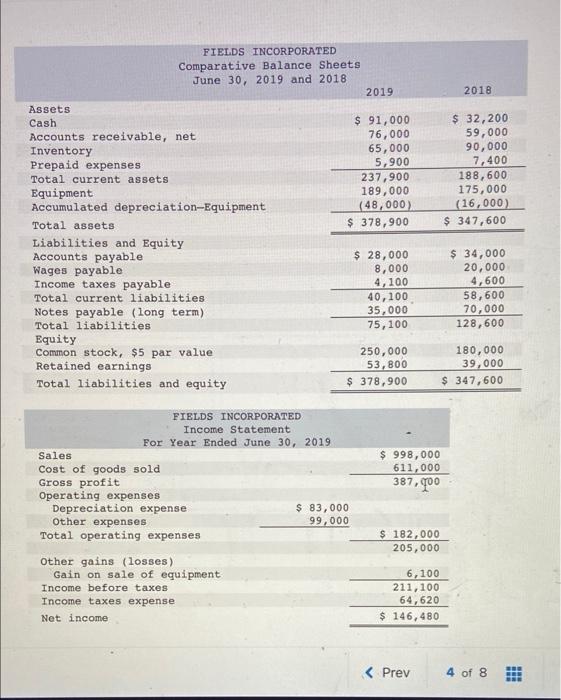
Assets FIELDS INCORPORATED Comparative Balance Sheets June 30, 2019 and 2018 Cash Accounts receivable, net Prepaid expenses Inventory Total current assets. Equipment Accumulated depreciation-Equipment Total assets Liabilities and Equity Accounts payable Wages payable Income taxes payable Total current liabilities Notes payable (long term) Total liabilities Equity Common stock, $5 par value Retained earnings Total liabilities and equity Sales FIELDS INCORPORATED Income Statement For Year Ended June 30, 2019 Cost of goods sold 2019 $ 91,000 76,000 2018 $ 32,200 59,000 65,000 90,000 5,900 7,400 237,900 188,600 189,000 175,000 $ 378,900 $ 28,000 (48,000) (16,000) $ 347,600 $ 34,000 8,000 20,000 4,100 4,600 40,100 58,600 35,000 70,000 75,100 128,600 250,000 180,000 53,800 39,000 $ 378,900 $ 347,600 Gross profit Operating expenses Depreciation expense Other expenses Total operating expenses Other gains (losses) Gain on sale of equipment Income before taxes Income taxes expense $ 83,000 99,000 Net income $ 998,000 611,000 387,900 $ 182,000 205,000 6,100 211,100 64,620 $ 146,480 < Prev 4 of 8
Step by Step Solution
There are 3 Steps involved in it

Get step-by-step solutions from verified subject matter experts