

Question: Assigned Corporation: General Motors 1) Using an Excel spreadsheet, you will create a three-year ratio trend analysis from the financial statements for your assigned corporation.
Assigned Corporation: General Motors
1) Using an Excel spreadsheet, you will create a three-year ratio trend analysis from the financial statements for your assigned corporation. The trend will consist of the following ratios:
- Current Ratio and the Quick Ratio from the I. Short term solvency, or liquidity, ratios category
- Return on Assets Ratio and the Return on Equity Ratio from the IV. Profitability ratios category
- Price Earnings Ratio and the Price Sales Ratio from the V. Market value ratios category.
Financial Statements:
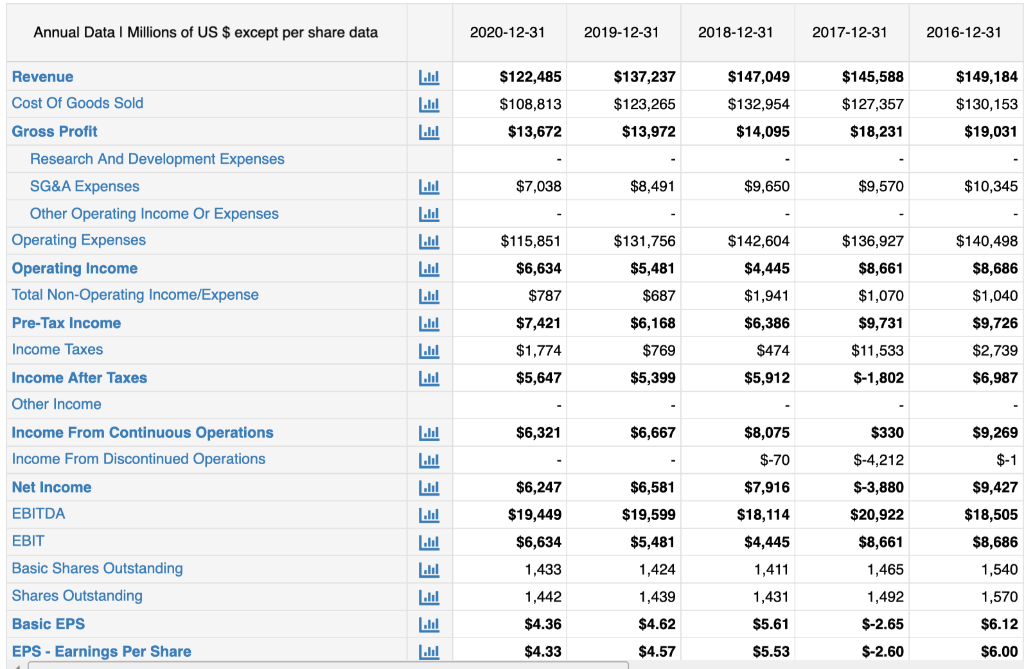
Annual Data 1 Millions of US $ except per share data 2020-12-31 2019-12-31 2018-12-31 2017-12-31 2016-12-31 Revenue $145,588 Cost Of Goods Sold EEE $122,485 $108,813 $13,672 $137,237 $123,265 $13,972 $147,049 $132,954 $127,357 $18,231 $149,184 $130,153 $19,031 Gross Profit $14,095 $7,038 $8,491 $9,650 $9,570 $10,345 Research And Development Expenses SG&A Expenses Other Operating Income Or Expenses Operating Expenses Operating Income Total Non-Operating Income/Expense Pre-Tax Income $115,851 $131,756 $142,604 $136,927 $6,634 $5,481 $4,445 $8,661 EEEEEEEE $140,498 $8,686 $1,040 $9,726 $787 $687 $6,168 $1,941 $6,386 $474 $1,070 $9,731 $7,421 Income Taxes $1,774 $769 $11,533 $2,739 $6,987 Income After Taxes $5,647 $5,399 $5,912 $-1,802 Other Income $6,321 $6,667 $8,075 $330 $9,269 Income From Continuous Operations Income From Discontinued Operations Net Income $-70 $-4,212 $-1 $6,581 $7,916 $-3,880 $9,427 EBITDA $6,247 $19,449 $6,634 $18,114 EEEEEEEEE $19,599 $5,481 $20,922 $8,661 EBIT Basic Shares Outstanding Shares Outstanding $4,445 $18,505 $8,686 1,540 1,570 1,433 1,424 1,411 1,465 1,442 1,439 1,431 1,492 Basic EPS $4.36 $4.62 $5.61 $-2.65 $6.12 EPS - Earnings Per Share $4.33 $4.57 $5.53 $-2.60 $6.00 Annual Data 1 Millions of US $ except per share data 2020-12-31 2019-12-31 2018-12-31 2017-12-31 2016-12-31 Revenue $145,588 Cost Of Goods Sold EEE $122,485 $108,813 $13,672 $137,237 $123,265 $13,972 $147,049 $132,954 $127,357 $18,231 $149,184 $130,153 $19,031 Gross Profit $14,095 $7,038 $8,491 $9,650 $9,570 $10,345 Research And Development Expenses SG&A Expenses Other Operating Income Or Expenses Operating Expenses Operating Income Total Non-Operating Income/Expense Pre-Tax Income $115,851 $131,756 $142,604 $136,927 $6,634 $5,481 $4,445 $8,661 EEEEEEEE $140,498 $8,686 $1,040 $9,726 $787 $687 $6,168 $1,941 $6,386 $474 $1,070 $9,731 $7,421 Income Taxes $1,774 $769 $11,533 $2,739 $6,987 Income After Taxes $5,647 $5,399 $5,912 $-1,802 Other Income $6,321 $6,667 $8,075 $330 $9,269 Income From Continuous Operations Income From Discontinued Operations Net Income $-70 $-4,212 $-1 $6,581 $7,916 $-3,880 $9,427 EBITDA $6,247 $19,449 $6,634 $18,114 EEEEEEEEE $19,599 $5,481 $20,922 $8,661 EBIT Basic Shares Outstanding Shares Outstanding $4,445 $18,505 $8,686 1,540 1,570 1,433 1,424 1,411 1,465 1,442 1,439 1,431 1,492 Basic EPS $4.36 $4.62 $5.61 $-2.65 $6.12 EPS - Earnings Per Share $4.33 $4.57 $5.53 $-2.60 $6.00
Step by Step Solution
There are 3 Steps involved in it

Get step-by-step solutions from verified subject matter experts