

Question: Assignment 1 - Asset Pricing Problems 5. There are three different potential states of the economy next year. The chart below shows you the returns
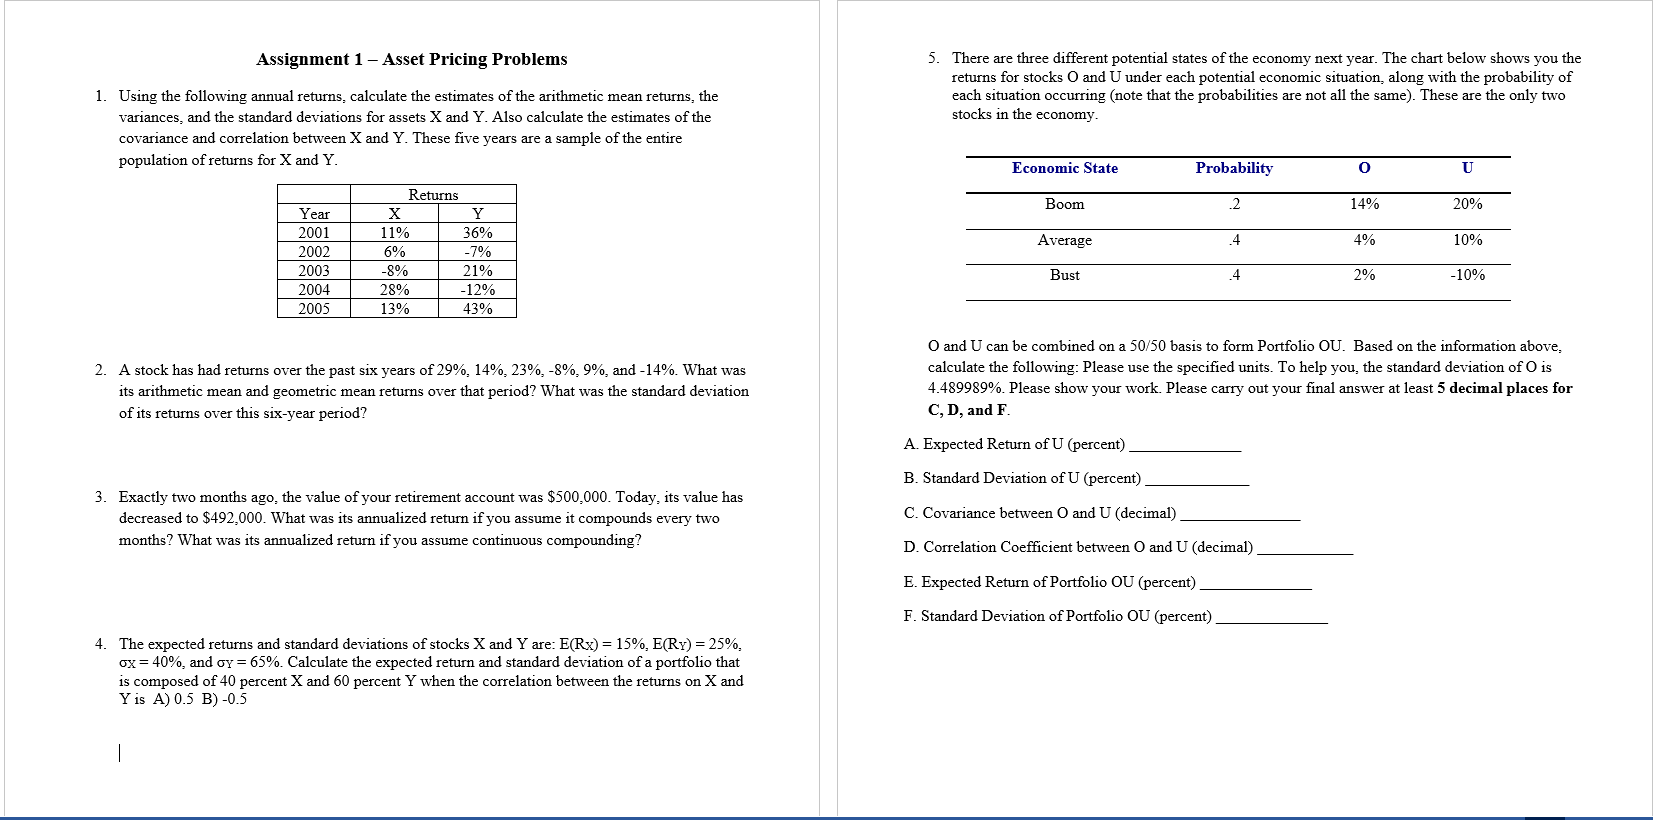
Assignment 1 - Asset Pricing Problems 5. There are three different potential states of the economy next year. The chart below shows you the returns for stocks O and U under each potential economic situation, along with the probability of 1. Using the following annual returns, calculate the estimates of the arithmetic mean returns, the each situation occurring (note that the probabilities are not all the same). These are the only two variances, and the standard deviations for assets X and Y. Also calculate the estimates of the stocks in the economy. covariance and correlation between X and Y. These five years are a sample of the entire population of returns for X and Y. O and U can be combined on a 50/50 basis to form Portfolio OU. Based on the information above, 2. A stock has had returns over the past six years of 29%,14%,23%,8%,9%, and 14%. What was calculate the following: Please use the specified units. To help you, the standard deviation of O is its arithmetic mean and geometric mean returns over that period? What was the standard deviation 4.489989%. Please show your work. Please carry out your final answer at least 5 decimal places for of its returns over this six-year period? C, D, and F. A. Expected Return of U (percent) B. Standard Deviation of U (percent) 3. Exactly two months ago, the value of your retirement account was $500,000. Today, its value has decreased to $492,000. What was its annualized return if you assume it compounds every two C. Covariance between O and U (decimal) D. Correlation Coefficient between O and U (decimal) E. Expected Return of Portfolio OU (percent) F. Standard Deviation of Portfolio OU (percent) 4. The expected returns and standard deviations of stocks X and Y are: E(Rx)=15%,E(RY)=25%, X=40%, and Y=65%. Calculate the expected return and standard deviation of a portfolio that is composed of 40 percent X and 60 percent Y when the correlation between the returns on X and Y is A) 0.5 B) -0.5
Step by Step Solution
There are 3 Steps involved in it

Get step-by-step solutions from verified subject matter experts