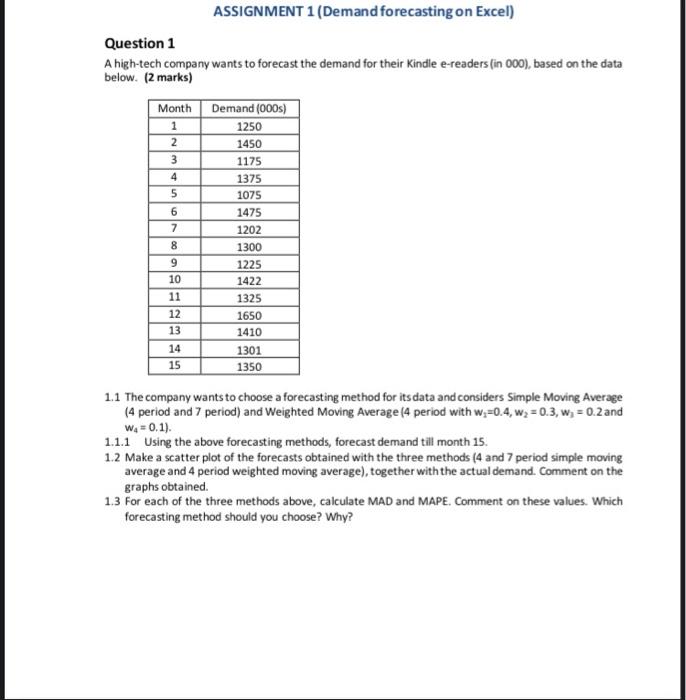
Question: ASSIGNMENT 1 (Demand forecasting on Excel) Question 1 A high-tech company wants to forecast the demand for their Kindle e-readers (in 000), based on the

ASSIGNMENT 1 (Demand forecasting on Excel)
ASSIGNMENT 1 (Demand forecasting on Excel) Question 1 A high-tech company wants to forecast the demand for their Kindle e-readers (in 000), based on the data below. (2 marks) Month 1 2 3 4 5 6 7 Demand (000s) 1250 1450 1175 1375 1075 1475 1202 1300 1225 1422 1325 1650 1410 1301 1350 8 9 10 11 12 13 14 15 1.1 The company wants to choose a forecasting method for its data and considers Simple Moving Average (4 period and 7 period) and Weighted Moving Average (4 period with w;=0.4,w2 = 0.3, w, = 0.2 and W4=0.1). 1.1.1 Using the above forecasting methods, forecast demand till month 15. 1.2 Make a scatter plot of the forecasts obtained with the three methods (4 and 7 period simple moving average and 4 period weighted moving average), together with the actual demand. Comment on the graphs obtained 1.3 For each of the three methods above, calculate MAD and MAPE. Comment on these values. Which forecasting method should you choose? Why? Question 2 Month 1 2 3 4 5 6 7 8 Demand (000s) 1250 1450 1557 1780 2025 2150 2388 2501 Month 9 10 11 12 13 14 15 Demand (000s) 2651 2871 2990 3099 3200 3351 3550 Using the above data, the Analyst would like to establish a Linear regression model for the demand, Using Excel, please run linear regression on this data (1 mark) 2.1 What is the Coefficient of Determination ( Squared)? What does it mean? 2.2 Use the model generate to predict the demand for Month #16 Question 3 A supply chain analyst is analyzing past sales data. He obtained the following numbers: Week 1 2 3 4 5 6 7 Demand 3825 3800 3780 3880 3850 3820 3876 3825 3780 3780 3770 3800 3750 3757 3750 8 9 10 11 12 13 14 15 He thinks that two methods could be used to forecast future sales: linear regression and weighted moving average. (1 mark) Question 3 A supply chain analyst is analyzing past sales data. He obtained the following numbers: Week 1 2 3 4 5 6 7 8 9 10 11 12 Demand 3825 3800 3780 3880 3850 3820 3876 3825 3780 3780 3770 3800 3750 3757 3750 14 15 He thinks that two methods could be used to forecast future sales: linear regression and weighted moving average. (1 mark) 3.1 Using Excel, please run linear regression on this data. Based on the results you obtain, do you think that linear regression is appropriate in this case? Why? 3.2 For the weighted moving average, the analyst wants to cakulate a four-period weighted moving average with weights 0.4, 0.3, 0.2 and 0.1. Piease apply the weighted moving average methods to calculate the sales forecast in weeks 5-15. APPENDIX: Suggestions for implementing Question 1-3 in Excel: 1. Create a single excel file for all three questions 2. Create a separate excel worksheet for each question 3. Make a table in Excel (one column for the month, another with the given demand data) 4. Rest of the columns in excel sheet can be used for you working 5. Label each column with headings and other information so that it is easily understandable 6. Solutions to the discussion aspects of the questions should be submitted in a word file with appropriate reference to the analysis in excels workbook

Step by Step Solution

There are 3 Steps involved in it

1 Expert Approved Answer
Step: 1 Unlock blur-text-image
Question Has Been Solved by an Expert!

Get step-by-step solutions from verified subject matter experts

Step: 2 Unlock
Step: 3 Unlock

Students Have Also Explored These Related General Management Questions!