

Question: Assignment 1: Forecasting 20 1) For the data below: Automobile Month Month Battery Sales January July February 21 August March 15 September April 14 October
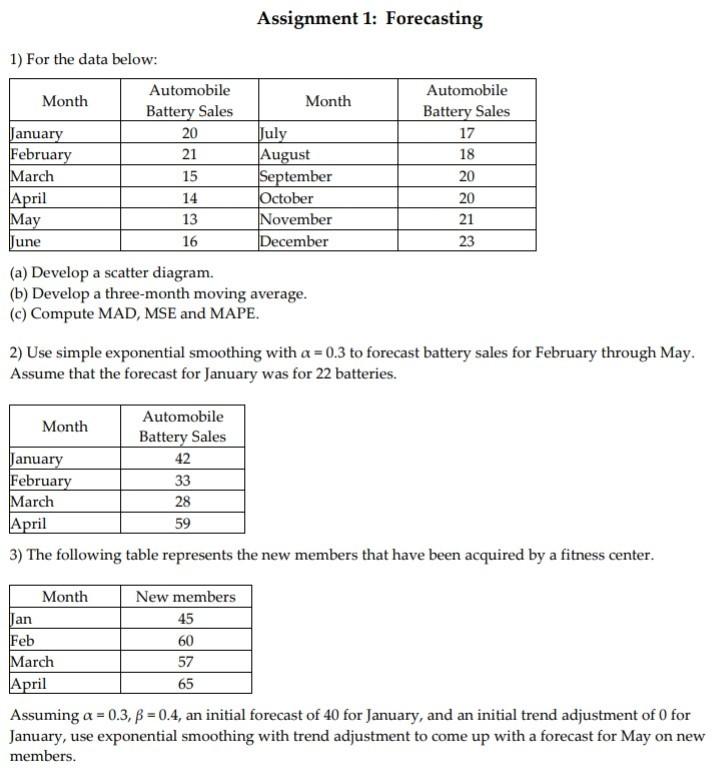

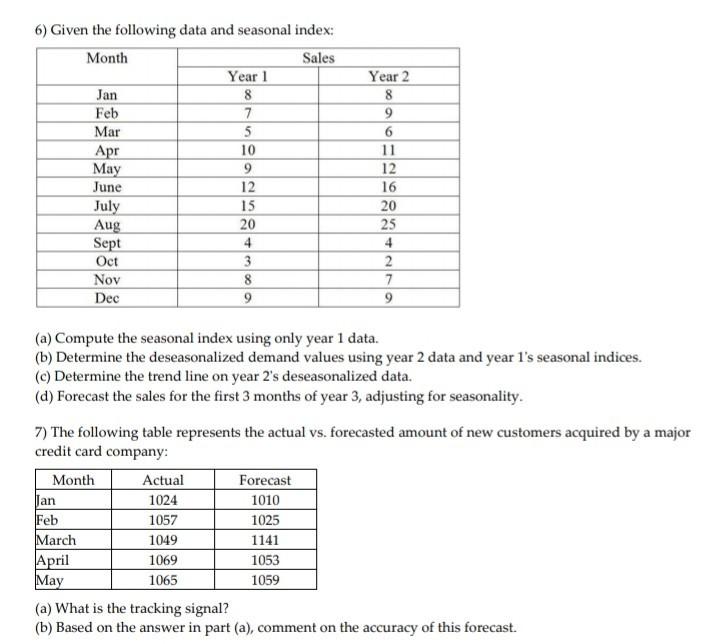


Assignment 1: Forecasting 20 1) For the data below: Automobile Month Month Battery Sales January July February 21 August March 15 September April 14 October May 13 November June 16 December (a) Develop a scatter diagram. (b) Develop a three-month moving average. (c) Compute MAD, MSE and MAPE. Automobile Battery Sales 17 18 20 20 21 23 2) Use simple exponential smoothing with a = 0.3 to forecast battery sales for February through May. Assume that the forecast for January was for 22 batteries. Automobile Month Battery Sales January 42 February 33 March 28 April 59 3) The following table represents the new members that have been acquired by a fitness center. Month New members Jan 45 Feb 60 March 57 April 65 Assuming a = 0.3, p = 0.4, an initial forecast of 40 for January, and an initial trend adjustment of O for January, use exponential smoothing with trend adjustment to come up with a forecast for May on new members. 6) Given the following data and seasonal index: Month Sales Year 1 Jan 8 Feb 7 Mar 5 Apr 10 May 9 June 12 July 15 Aug 20 Sept 4 Oct 3 Nov 8 Dec 9 Year 2 8 9 6 11 12 16 20 25 4 2 7 9 (a) Compute the seasonal index using only year 1 data. (b) Determine the deseasonalized demand values using year 2 data and year l's seasonal indices. (c) Determine the trend line on year 2's deseasonalized data. (d) Forecast the sales for the first 3 months of year 3, adjusting for seasonality. 7) The following table represents the actual vs. forecasted amount of new customers acquired by a major credit card company: Month Actual Forecast Jan 1024 1010 Feb 1057 1025 March 1049 1141 April 1069 1053 May 1065 1059 (a) What is the tracking signal? (b) Based on the answer in part (a), comment on the accuracy of this forecast. 6) Given the following data and seasonal index: Month Sales Year 1 Jan 8 Feb 7 Mar 5 Apr 10 May 9 June 12 July 15 Aug 20 Sept 4 Oct 3 Nov 8 Dec 9 Year 2 8 9 6 11 12 16 20 25 4 2 7 9 (a) Compute the seasonal index using only year 1 data. (b) Determine the deseasonalized demand values using year 2 data and year l's seasonal indices. (c) Determine the trend line on year 2's deseasonalized data. (d) Forecast the sales for the first 3 months of year 3, adjusting for seasonality. 7) The following table represents the actual vs. forecasted amount of new customers acquired by a major credit card company: Month Actual Forecast Jan 1024 1010 Feb 1057 1025 March 1049 1141 April 1069 1053 May 1065 1059 (a) What is the tracking signal? (b) Based on the answer in part (a), comment on the accuracy of this forecast. 6) Given the following data and seasonal index: Month Sales Year 1 Jan 8 Feb 7 Mar 5 Apr 10 May 9 June 12 July 15 Aug 20 Sept 4 Oct 3 Nov 8 Dec 9 Year 2 8 9 6 11 12 16 20 25 4 2 7 9 (a) Compute the seasonal index using only year 1 data. (b) Determine the deseasonalized demand values using year 2 data and year l's seasonal indices. (c) Determine the trend line on year 2's deseasonalized data. (d) Forecast the sales for the first 3 months of year 3, adjusting for seasonality. 7) The following table represents the actual vs. forecasted amount of new customers acquired by a major credit card company: Month Actual Forecast Jan 1024 1010 Feb 1057 1025 March 1049 1141 April 1069 1053 May 1065 1059 (a) What is the tracking signal? (b) Based on the answer in part (a), comment on the accuracy of this forecast. 6) Given the following data and seasonal index: Month Sales Year 1 Jan 8 Feb 7 Mar 5 Apr 10 May 9 June 12 July 15 Aug 20 Sept 4 Oct 3 Nov 8 Dec 9 Year 2 8 9 6 11 12 16 20 25 4 2 7 9 (a) Compute the seasonal index using only year 1 data. (b) Determine the deseasonalized demand values using year 2 data and year l's seasonal indices. (c) Determine the trend line on year 2's deseasonalized data. (d) Forecast the sales for the first 3 months of year 3, adjusting for seasonality. 7) The following table represents the actual vs. forecasted amount of new customers acquired by a major credit card company: Month Actual Forecast Jan 1024 1010 Feb 1057 1025 March 1049 1141 April 1069 1053 May 1065 1059 (a) What is the tracking signal? (b) Based on the answer in part (a), comment on the accuracy of this forecast
Step by Step Solution
There are 3 Steps involved in it
1 Expert Approved Answer
Step: 1 Unlock

Question Has Been Solved by an Expert!
Get step-by-step solutions from verified subject matter experts
Step: 2 Unlock
Step: 3 Unlock