

Question: Assignment #1 (Introduction to Time Series Analysis) Total points (15) Q).1-3 Plot and Estimate by using the following data and Let us look at these
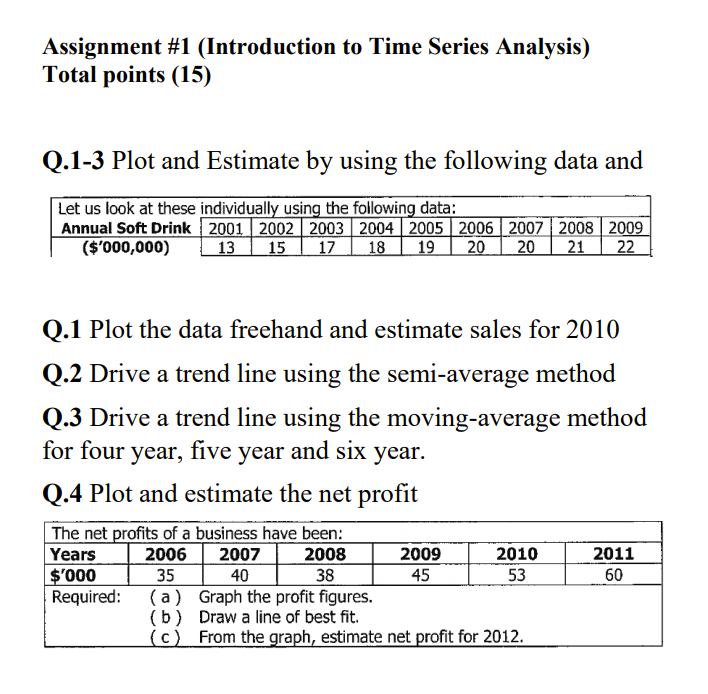
Assignment #1 (Introduction to Time Series Analysis) Total points (15) Q).1-3 Plot and Estimate by using the following data and Let us look at these individually using the following data: Annual Soft Drink 2001 2002 2003 2004 2005 2006 2007 2008 2009 ($'000,000) 13 15 17 18 19 20 20 21 22 Q.1 Plot the data freehand and estimate sales for 2010 Q.2 Drive a trend line using the semi-average method Q.3 Drive a trend line using the moving-average method for four year, five year and six year. Q.4 Plot and estimate the net profit The net profits of a business have been: Years 2006 2007 2008 2009 2010 2011 $'000 35 40 38 45 53 60 Required: (a ) Graph the profit figures. (b ) Draw a line of best fit. (c ) From the graph, estimate net profit for 2012
Step by Step Solution
There are 3 Steps involved in it

Get step-by-step solutions from verified subject matter experts