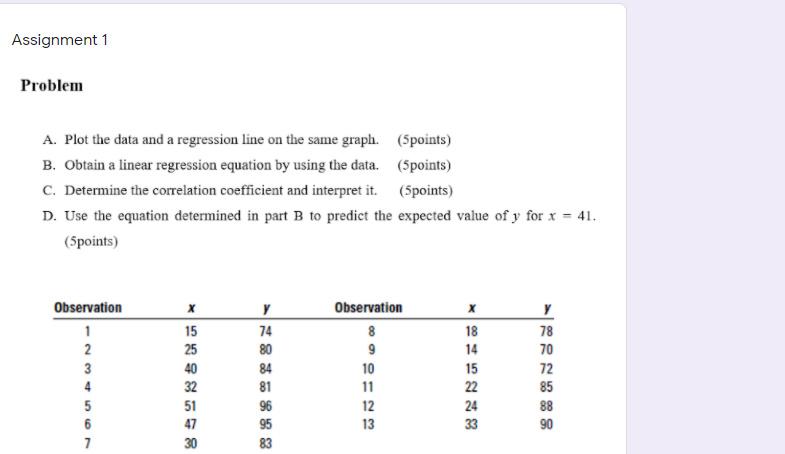
Question: Assignment 1 Problem A. Plot the data and a regression line on the same graph. (5points) B. Obtain a linear regression equation by using the

Assignment 1 Problem A. Plot the data and a

Assignment 1 Problem A. Plot the data and a regression line on the same graph. (5points) B. Obtain a linear regression equation by using the data. (Spoints) C. Determine the correlation coefficient and interpret it. (Spoints) D. Use the equation determined in part B to predict the expected value of y for x = 41. (Spoints) X Observation 1 3 4 5 6 7 15 25 40 32 51 47 30 Y 74 80 84 81 96 95 83 Observation 8 9 10 11 12 13 18 14 15 22 24 33 y 78 70 72 85 88 90

Step by Step Solution

There are 3 Steps involved in it

1 Expert Approved Answer
Step: 1 Unlock blur-text-image
Question Has Been Solved by an Expert!

Get step-by-step solutions from verified subject matter experts

Step: 2 Unlock
Step: 3 Unlock

Students Have Also Explored These Related General Management Questions!