

Question: Assignment 1 Quantitative Methods The data for the exercises below are provided in the Excel Worksheet (Assignment 1). Please create a Microsoft Word file with
- Assignment 1
Quantitative Methods
The data for the exercises below are provided in the Excel Worksheet (Assignment 1). Please create a Microsoft Word file with the answers to the questions below. You can copy tables, formulas, graphs etc from your Excel worksheet onto the Word document for answering the assignment questions.
The following questions are related to the worksheet named “JDPower”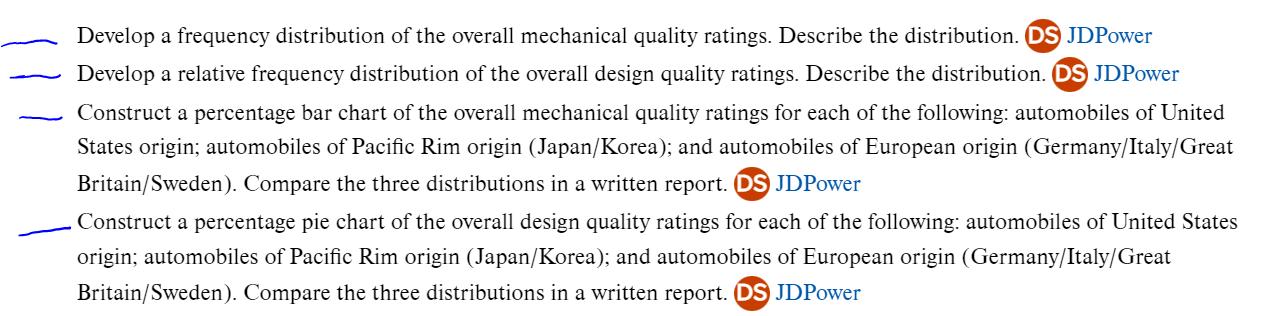
- The following scenario is related to the worksheet named “JeepSales”.
 Construct percent bar charts of
 - Jeep sales 2011
- Jeep sales in 2006
J. D. Power Initial Quality Study of 2014 Automobiles Company Country of Origin Overall Quality Mechanical Overall Quality Design Acura Japan 3 3 Audi Germany 4 3 BMW Germany 4 3 Buick United States 4 3 Cadillac United States 4 3 Chevrolet United States 3 3 Chrysler United States 3 4 Dodge United States 2 3 Fiat Italy 2 2 Ford United States 3 3 GMC United States 3 3 Honda Japan 3 3 Hyundai Korea 4 4 Infiniti Japan 3 3 Jaguar Great Britain 3 5 Jeep United States 2 3 Kia Korea 3 3 Land Rover Great Britain 2 3 Lexus Japan 5 3 Lincoln United States 4 3 Mazda Japan 3 2 Mercedes-Benz Germany 3 3 MINI Great Britain 4 2 Mitsubishi Japan 2 3 Nissan Japan 3 3 Porsche Germany 4 5 Ram United States 2 4 Scion Japan 3 3 Subaru Japan 3 2 Toyota Japan 4 3 Volkswagen Germany 3 3 Volvo Sweden 3 3 Scoring Legend 5 = Among the best 4 = Better than most 3 = About average 2 = The rest
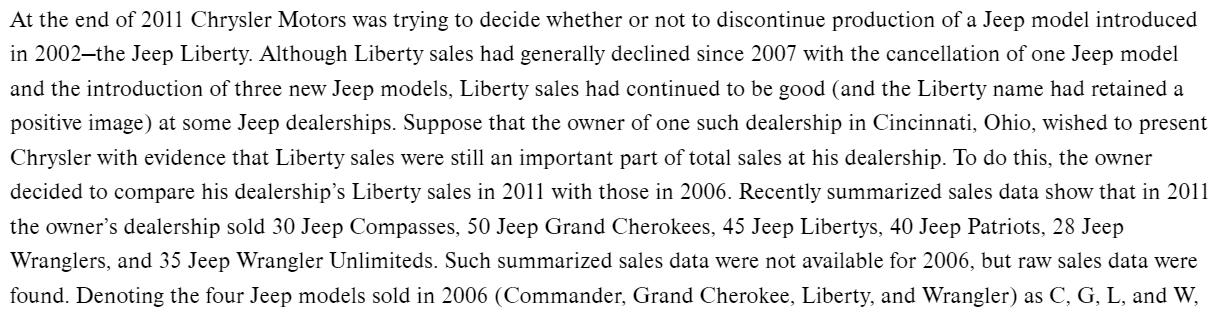
Compare the charts and write a short report supporting the owner’s position that in 2011, Liberty sales were still an important part of sales at the dealership.
Develop a frequency distribution of the overall mechanical quality ratings. Describe the distribution. DS JDPower Develop a relative frequency distribution of the overall design quality ratings. Describe the distribution. DS JDPower Construct a percentage bar chart of the overall mechanical quality ratings for each of the following: automobiles of United States origin; automobiles of Pacific Rim origin (Japan/Korea); and automobiles of European origin (Germany/Italy/Great Britain/Sweden). Compare the three distributions in a written report. DS JDPower Construct a percentage pie chart of the overall design quality ratings for each of the following: automobiles of United States origin; automobiles of Pacific Rim origin (Japan/Korea); and automobiles of European origin (Germany/Italy/Great Britain/Sweden). Compare the three distributions in a written report. DS JDPower
Step by Step Solution
3.53 Rating (160 Votes )
There are 3 Steps involved in it
Construct the bar chart for the data r... View full answer

Get step-by-step solutions from verified subject matter experts