

Question: Assignment 1 Solve this problem as a team in the Excel template file provided. Name your final solution file as: Assignment1_LastName1_LastName2_LastName3_LastName4.xlsx Also, write your full
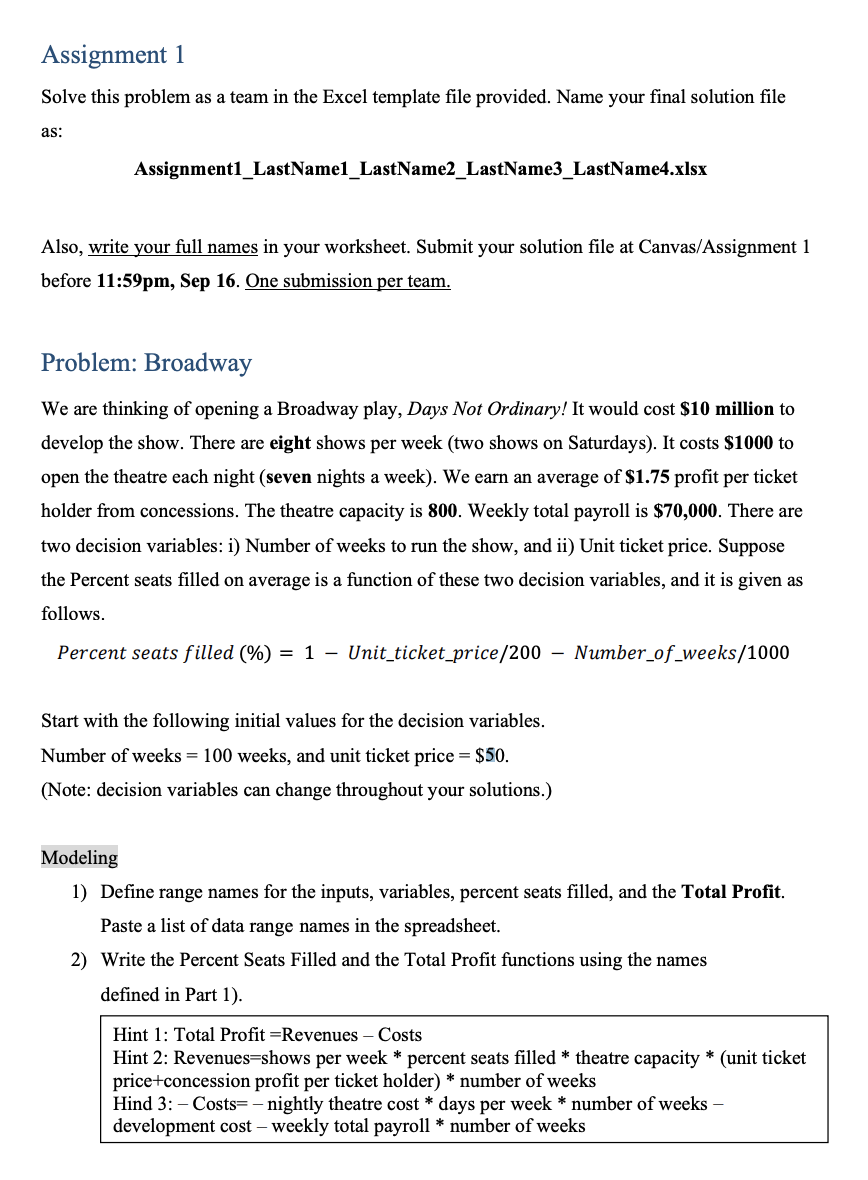
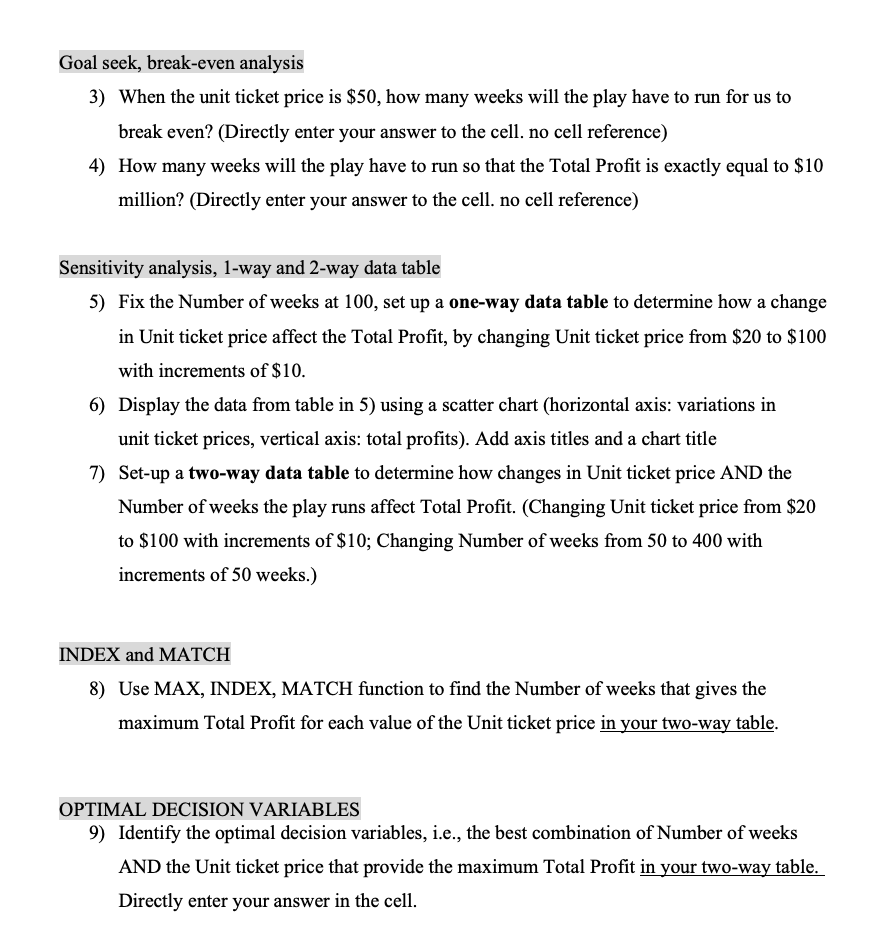
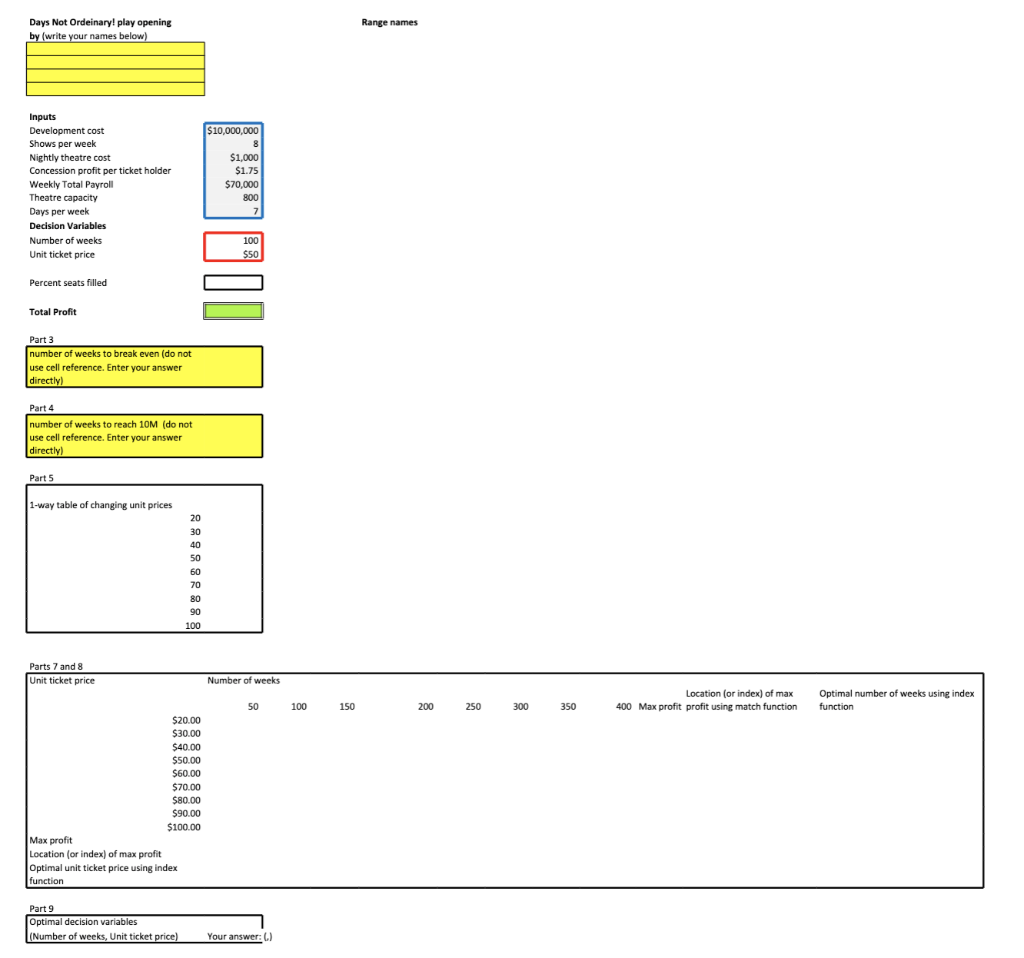
Assignment 1 Solve this problem as a team in the Excel template file provided. Name your final solution file as: Assignment1_LastName1_LastName2_LastName3_LastName4.xlsx Also, write your full names in your worksheet. Submit your solution file at Canvas/Assignment 1 before 11:59pm, Sep 16. One submission per team. Problem: Broadway We are thinking of opening a Broadway play, Days Not Ordinary! It would cost $10 million to develop the show. There are eight shows per week (two shows on Saturdays). It costs $1000 to open the theatre each night (seven nights a week). We earn an average of $1.75 profit per ticket holder from concessions. The theatre capacity is 800. Weekly total payroll is $70,000. There are two decision variables: i) Number of weeks to run the show, and ii) Unit ticket price. Suppose the Percent seats filled on average is a function of these two decision variables, and it is given as follows. Percent seats filled (%)=1 - Unit_ticket_price /200 - Number_of_weeks /1000 Start with the following initial values for the decision variables. Number of weeks =100 weeks, and unit ticket price =$50. (Note: decision variables can change throughout your solutions.) Modeling 1) Define range names for the inputs, variables, percent seats filled, and the Total Profit. Paste a list of data range names in the spreadsheet. 2) Write the Percent Seats Filled and the Total Profit functions using the names defined in Part 1). Hint 1: Total Profit = Revenues Costs Hint 2: Revenues=shows per week * percent seats filled * theatre capacity * (unit ticket price+concession profit per ticket holder) number of weeks Hind 3: - Costs = nightly theatre cost * days per week * number of weeks development cost - weekly total payroll * number of weeks Goal seek, break-even analysis 3) When the unit ticket price is $50, how many weeks will the play have to run for us to break even? (Directly enter your answer to the cell. no cell reference) 4) How many weeks will the play have to run so that the Total Profit is exactly equal to $10 million? (Directly enter your answer to the cell. no cell reference) Sensitivity analysis, 1-way and 2-way data table 5) Fix the Number of weeks at 100, set up a one-way data table to determine how a change in Unit ticket price affect the Total Profit, by changing Unit ticket price from $20 to $100 with increments of $10. 6) Display the data from table in 5) using a scatter chart (horizontal axis: variations in unit ticket prices, vertical axis: total profits). Add axis titles and a chart title 7) Set-up a two-way data table to determine how changes in Unit ticket price AND the Number of weeks the play runs affect Total Profit. (Changing Unit ticket price from $20 to $100 with increments of $10; Changing Number of weeks from 50 to 400 with increments of 50 weeks.) INDEX and MATCH 8) Use MAX, INDEX, MATCH function to find the Number of weeks that gives the maximum Total Profit for each value of the Unit ticket price in your two-way table. OPTIMAL DECISION VARIABLES 9) Identify the optimal decision variables, i.e., the best combination of Number of weeks AND the Unit ticket price that provide the maximum Total Profit in your two-way table. Directly enter your answer in the cell. Days Not Ordeinary! play opening Range names by (write your names below) Part 9 Optimal decision variables (Number of weeks, Unit ticket price) Your answer: (.) Assignment 1 Solve this problem as a team in the Excel template file provided. Name your final solution file as: Assignment1_LastName1_LastName2_LastName3_LastName4.xlsx Also, write your full names in your worksheet. Submit your solution file at Canvas/Assignment 1 before 11:59pm, Sep 16. One submission per team. Problem: Broadway We are thinking of opening a Broadway play, Days Not Ordinary! It would cost $10 million to develop the show. There are eight shows per week (two shows on Saturdays). It costs $1000 to open the theatre each night (seven nights a week). We earn an average of $1.75 profit per ticket holder from concessions. The theatre capacity is 800. Weekly total payroll is $70,000. There are two decision variables: i) Number of weeks to run the show, and ii) Unit ticket price. Suppose the Percent seats filled on average is a function of these two decision variables, and it is given as follows. Percent seats filled (%)=1 - Unit_ticket_price /200 - Number_of_weeks /1000 Start with the following initial values for the decision variables. Number of weeks =100 weeks, and unit ticket price =$50. (Note: decision variables can change throughout your solutions.) Modeling 1) Define range names for the inputs, variables, percent seats filled, and the Total Profit. Paste a list of data range names in the spreadsheet. 2) Write the Percent Seats Filled and the Total Profit functions using the names defined in Part 1). Hint 1: Total Profit = Revenues Costs Hint 2: Revenues=shows per week * percent seats filled * theatre capacity * (unit ticket price+concession profit per ticket holder) number of weeks Hind 3: - Costs = nightly theatre cost * days per week * number of weeks development cost - weekly total payroll * number of weeks Goal seek, break-even analysis 3) When the unit ticket price is $50, how many weeks will the play have to run for us to break even? (Directly enter your answer to the cell. no cell reference) 4) How many weeks will the play have to run so that the Total Profit is exactly equal to $10 million? (Directly enter your answer to the cell. no cell reference) Sensitivity analysis, 1-way and 2-way data table 5) Fix the Number of weeks at 100, set up a one-way data table to determine how a change in Unit ticket price affect the Total Profit, by changing Unit ticket price from $20 to $100 with increments of $10. 6) Display the data from table in 5) using a scatter chart (horizontal axis: variations in unit ticket prices, vertical axis: total profits). Add axis titles and a chart title 7) Set-up a two-way data table to determine how changes in Unit ticket price AND the Number of weeks the play runs affect Total Profit. (Changing Unit ticket price from $20 to $100 with increments of $10; Changing Number of weeks from 50 to 400 with increments of 50 weeks.) INDEX and MATCH 8) Use MAX, INDEX, MATCH function to find the Number of weeks that gives the maximum Total Profit for each value of the Unit ticket price in your two-way table. OPTIMAL DECISION VARIABLES 9) Identify the optimal decision variables, i.e., the best combination of Number of weeks AND the Unit ticket price that provide the maximum Total Profit in your two-way table. Directly enter your answer in the cell. Days Not Ordeinary! play opening Range names by (write your names below) Part 9 Optimal decision variables (Number of weeks, Unit ticket price) Your answer: (.)
Step by Step Solution
There are 3 Steps involved in it

Get step-by-step solutions from verified subject matter experts