

Question: Assignment 1 The R code & line plot of the boys, girls and total all on the same plot and in separate color. Do not
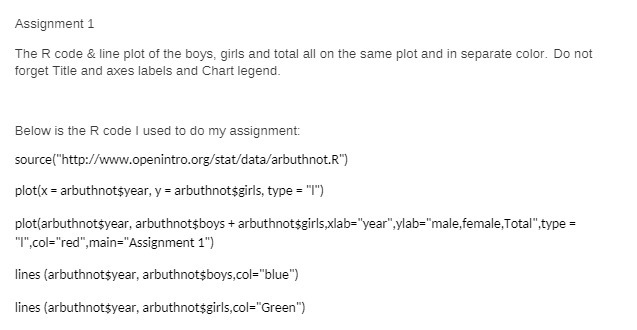
Assignment 1 The R code & line plot of the boys, girls and total all on the same plot and in separate color. Do not forget Title and axes labels and Chart legend. Below is the R code I used to do my assignment: source("http://www.openintro.org/stat/data/arbuthnot.R") plot(x = arbuthnot$year, y = arbuthnot$girls, type = "I") plot(arbuthnot$year, arbuthnot$boys + arbuthnot$girls,xlab="year",ylab="male,female,Total",type = "I",col="red",main="Assignment 1") lines (arbuthnot$year, arbuthnot$boys,col="blue") lines (arbuthnot$year, arbuthnot$girls,col="Green")
Step by Step Solution
There are 3 Steps involved in it
1 Expert Approved Answer
Step: 1 Unlock

Question Has Been Solved by an Expert!
Get step-by-step solutions from verified subject matter experts
Step: 2 Unlock
Step: 3 Unlock