

Question: Assignment 1: Using Matlab Simulink to plot the following function for 7 Fourier series terms (n=7) 1 0 < x < 1 f(x)= -1
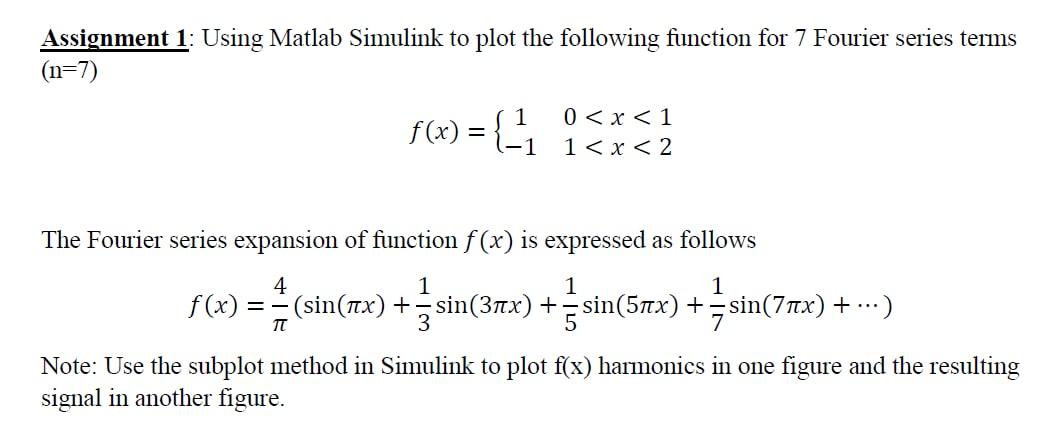
Assignment 1: Using Matlab Simulink to plot the following function for 7 Fourier series terms (n=7) 1 0 < x < 1 f(x)= -1 1 < x < 2 The Fourier series expansion of function f(x) is expressed as follows 4 1 1 1 f(x) = = (sin(x)+sin(3x) + =sin(5x) += sin(7x) + ) T Note: Use the subplot method in Simulink to plot f(x) harmonics in one figure and the resulting signal in another figure.
Step by Step Solution
★★★★★
3.51 Rating (151 Votes )
There are 3 Steps involved in it
1 Expert Approved Answer
Step: 1 Unlock

Question Has Been Solved by an Expert!
Get step-by-step solutions from verified subject matter experts
Step: 2 Unlock
Step: 3 Unlock