Question: Assignment 1. Using the historic data given in Figure 3.22 (through August of year 0), develop your own fore- cast for the next two years.
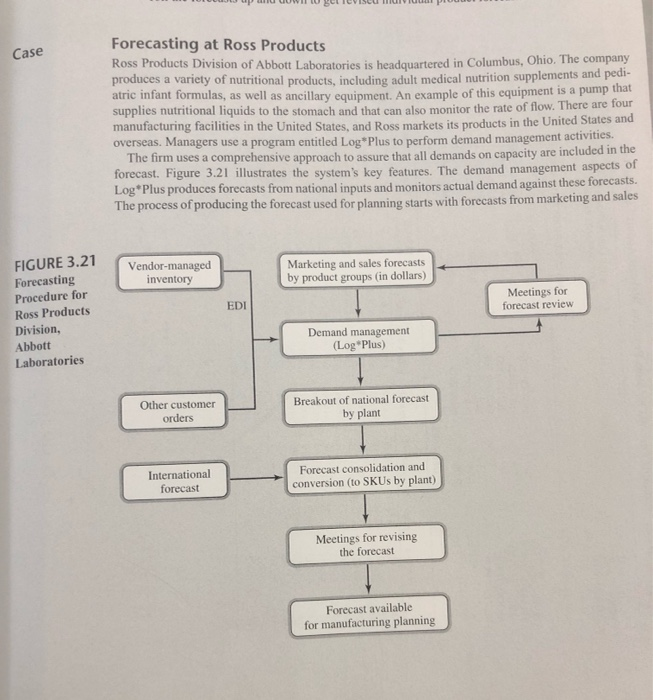
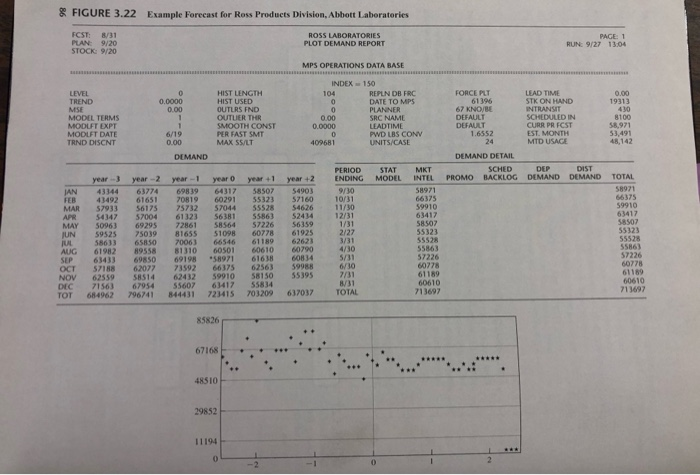
Assignment 1. Using the historic data given in Figure 3.22 (through August of year 0), develop your own fore- cast for the next two years. Use the regression techniques described in the chapter. 2. How do your forecasts compare to those shown in the Ross report? Case Forecasting at Ross Products Ross Products Division of Abbott Laboratories is headquartered in Columbus, Ohio. The company produces a variety of nutritional products, including adult medical nutrition supplements and pedi- atric infant formulas, as well as ancillary equipment. An example of this equipment is a pump that supplies nutritional liquids to the stomach and that can also monitor the rate of flow. There are four manufacturing facilities in the United States, and Ross markets its products in the United States and overseas. Managers use a program entitled Log Plus to perform demand management activities. The firm uses a comprehensive approach to assure that all demands on capacity are included in the forecast. Figure 3.21 illustrates the system's key features. The demand management aspects of Log*Plus produces forecasts from national inputs and monitors actual demand against these forecasts. The process of producing the forecast used for planning starts with forecasts from marketing and sales Vendor-managed inventory Marketing and sales forecasts by product groups (in dollars) Meetings for forecast review EDI FIGURE 3.21 Forecasting Procedure for Ross Products Division, Abbott Laboratories Demand management (LogPlus) Other customer orders Breakout of national forecast by plant International forecast Forecast consolidation and conversion (to SKUs by plant) Meetings for revising the forecast Forecast available for manufacturing planning & FIGURE 3.22 Example Forecast for Ross Products Division, Abbott Laboratories FCST: 8/31 PLAN: 9/20 STOCK: 9/20 ROSS LABORATORIES PLOT DEMAND REPORT PAGE: 1 RUN: 9/27 13:04 MPS OPERATIONS DATABASE 0.0000 0.00 LEVEL TREND MSE MODEL TERMS MODLFT EXPT MODLFT DATE TRND DISCNT HIST LENGTH HIST USED OUTLRS FND OUTLER THER SMOOTH CONST PER FAST SMT MAX SS/LT INDEX 150 104 REPLN DB FRC 0 DATE TO MPS 0 PLANNER 0.00 SRC NAME 0.0000 LEADTIME 0 PWD LBS CONV 409681 UNITS/CASE FORCE PLT 61396 67 KNOJE DEFAULT DEFAULT 1.6552 24 LEAD TIME STK ON HAND INTRANSIT SCHEDULED IN CURR PR FCST EST. MONTH MTD USACE 0.00 19313 430 8100 58,971 53,491 48,142 i 6/19 0.00 DEMAND STAT MODEL DEMAND DETAIL SCHED PROMO BACKLOG DEP DIST DEMAND DEMAND PERIOD ENDING 9/30 10/31 11/30 12/31 MKT INTEL 58971 66375 59910 63417 58502 year +2 54903 57160 54626 52414 56359 61925 JAN FEB MAR APR MAY JUN JUL AUG SEP OCT NOV DEC TOT year) 43344 43492 57933 54347 50963 59525 58633 61982 63433 57188 62559 71563 684962 year-2 63774 61651 56175 57004 69295 75039 65850 89558 69850 62077 58514 67954 796741 year - 1 69839 70819 75732 61323 72861 81655 70063 81310 69198 73592 62432 55607 844431 year o 64317 60291 57044 56381 58564 5109 66546 60501 *58971 66375 59910 63417 723415 year +1 58507 55323 55528 55863 57226 60778 61189 60610 61638 62563 58150 55834 703209 2/27 3/31 4/30 5/31 6/30 7/31 8/31 TOTAL 60790 60834 59988 55395 TOTAL 58971 66375 59910 63417 58507 55323 55528 55863 57226 60778 61189 60610 713697 55323 5552 55863 57226 60778 61189 60610 713697 637037 85826 67168 48510 29852 11194 Case 87 in dollars by product groups. These are broken out by region in Log*Plus to provide plant-level force casts of national demand. These data are consolidated with the forecast for international sales and the total is converted to an item level forecast by plant. The process is not finished, however, until market- ing, the product manager, and the production and inventory manager review the forecasts. Three times a year, meetings are held to review forecasts for all products in conjunction with budget meetings. These meetings can be held monthly for products that are experiencing changes, promotions, or other factors that could change demand. To provide a service to customers and directly capture information on the market, Ross manages product inventory in some of its customers' facilities using VMI. Information on the use of these products is transmitted to Ross by electronic data interchange (EDI). These data are combined with the forecasts to produce reports such as the one shown in Figure 3.22 for SKU XYZ, a medical nutrition product in 8-ounce cans. The top of the figure shows several years' actual sales with two years and three months of forecast sales. (The current month is shown with an asterisk in year 0.) To facilitate any review of the forecasts, the data are plotted in the bottom half of the report. Here the seasonality is quite evident as is a sales peak about a year and a half ago (because of a promotion). These forecasts are a basic input to the master production scheduling module of the firm. Assignment 1. Using the historic data given in Figure 3.22 (through August of year 0), develop your own fore- cast for the next two years. Use the regression techniques described in the chapter 2. How do your forecasts compare to those shown in the Ross report? Assignment 1. Using the historic data given in Figure 3.22 (through August of year 0), develop your own fore- cast for the next two years. Use the regression techniques described in the chapter. 2. How do your forecasts compare to those shown in the Ross report? Case Forecasting at Ross Products Ross Products Division of Abbott Laboratories is headquartered in Columbus, Ohio. The company produces a variety of nutritional products, including adult medical nutrition supplements and pedi- atric infant formulas, as well as ancillary equipment. An example of this equipment is a pump that supplies nutritional liquids to the stomach and that can also monitor the rate of flow. There are four manufacturing facilities in the United States, and Ross markets its products in the United States and overseas. Managers use a program entitled Log Plus to perform demand management activities. The firm uses a comprehensive approach to assure that all demands on capacity are included in the forecast. Figure 3.21 illustrates the system's key features. The demand management aspects of Log*Plus produces forecasts from national inputs and monitors actual demand against these forecasts. The process of producing the forecast used for planning starts with forecasts from marketing and sales Vendor-managed inventory Marketing and sales forecasts by product groups (in dollars) Meetings for forecast review EDI FIGURE 3.21 Forecasting Procedure for Ross Products Division, Abbott Laboratories Demand management (LogPlus) Other customer orders Breakout of national forecast by plant International forecast Forecast consolidation and conversion (to SKUs by plant) Meetings for revising the forecast Forecast available for manufacturing planning & FIGURE 3.22 Example Forecast for Ross Products Division, Abbott Laboratories FCST: 8/31 PLAN: 9/20 STOCK: 9/20 ROSS LABORATORIES PLOT DEMAND REPORT PAGE: 1 RUN: 9/27 13:04 MPS OPERATIONS DATABASE 0.0000 0.00 LEVEL TREND MSE MODEL TERMS MODLFT EXPT MODLFT DATE TRND DISCNT HIST LENGTH HIST USED OUTLRS FND OUTLER THER SMOOTH CONST PER FAST SMT MAX SS/LT INDEX 150 104 REPLN DB FRC 0 DATE TO MPS 0 PLANNER 0.00 SRC NAME 0.0000 LEADTIME 0 PWD LBS CONV 409681 UNITS/CASE FORCE PLT 61396 67 KNOJE DEFAULT DEFAULT 1.6552 24 LEAD TIME STK ON HAND INTRANSIT SCHEDULED IN CURR PR FCST EST. MONTH MTD USACE 0.00 19313 430 8100 58,971 53,491 48,142 i 6/19 0.00 DEMAND STAT MODEL DEMAND DETAIL SCHED PROMO BACKLOG DEP DIST DEMAND DEMAND PERIOD ENDING 9/30 10/31 11/30 12/31 MKT INTEL 58971 66375 59910 63417 58502 year +2 54903 57160 54626 52414 56359 61925 JAN FEB MAR APR MAY JUN JUL AUG SEP OCT NOV DEC TOT year) 43344 43492 57933 54347 50963 59525 58633 61982 63433 57188 62559 71563 684962 year-2 63774 61651 56175 57004 69295 75039 65850 89558 69850 62077 58514 67954 796741 year - 1 69839 70819 75732 61323 72861 81655 70063 81310 69198 73592 62432 55607 844431 year o 64317 60291 57044 56381 58564 5109 66546 60501 *58971 66375 59910 63417 723415 year +1 58507 55323 55528 55863 57226 60778 61189 60610 61638 62563 58150 55834 703209 2/27 3/31 4/30 5/31 6/30 7/31 8/31 TOTAL 60790 60834 59988 55395 TOTAL 58971 66375 59910 63417 58507 55323 55528 55863 57226 60778 61189 60610 713697 55323 5552 55863 57226 60778 61189 60610 713697 637037 85826 67168 48510 29852 11194 Case 87 in dollars by product groups. These are broken out by region in Log*Plus to provide plant-level force casts of national demand. These data are consolidated with the forecast for international sales and the total is converted to an item level forecast by plant. The process is not finished, however, until market- ing, the product manager, and the production and inventory manager review the forecasts. Three times a year, meetings are held to review forecasts for all products in conjunction with budget meetings. These meetings can be held monthly for products that are experiencing changes, promotions, or other factors that could change demand. To provide a service to customers and directly capture information on the market, Ross manages product inventory in some of its customers' facilities using VMI. Information on the use of these products is transmitted to Ross by electronic data interchange (EDI). These data are combined with the forecasts to produce reports such as the one shown in Figure 3.22 for SKU XYZ, a medical nutrition product in 8-ounce cans. The top of the figure shows several years' actual sales with two years and three months of forecast sales. (The current month is shown with an asterisk in year 0.) To facilitate any review of the forecasts, the data are plotted in the bottom half of the report. Here the seasonality is quite evident as is a sales peak about a year and a half ago (because of a promotion). These forecasts are a basic input to the master production scheduling module of the firm. Assignment 1. Using the historic data given in Figure 3.22 (through August of year 0), develop your own fore- cast for the next two years. Use the regression techniques described in the chapter 2. How do your forecasts compare to those shown in the Ross report