

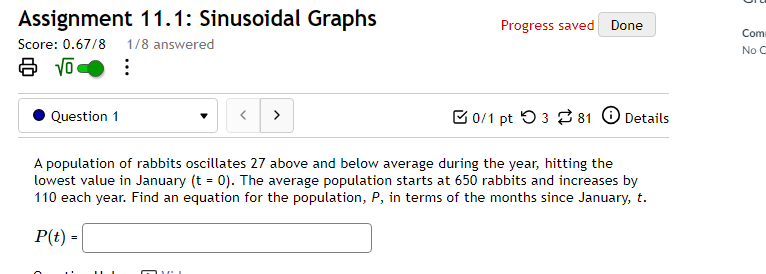
Question: Assignment 11.1: Sinusoidal Graphs Progress saved Done Com Score: 0.67/8 1/8 answered No C $ Vo . . . Question 1 Next question Get a
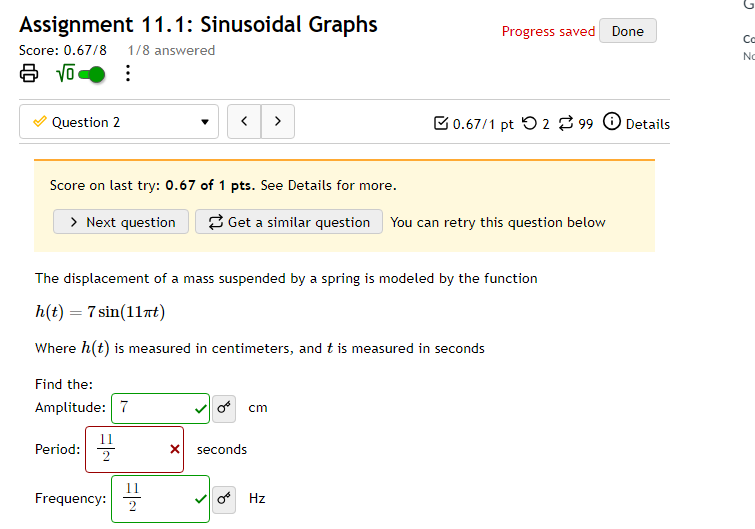
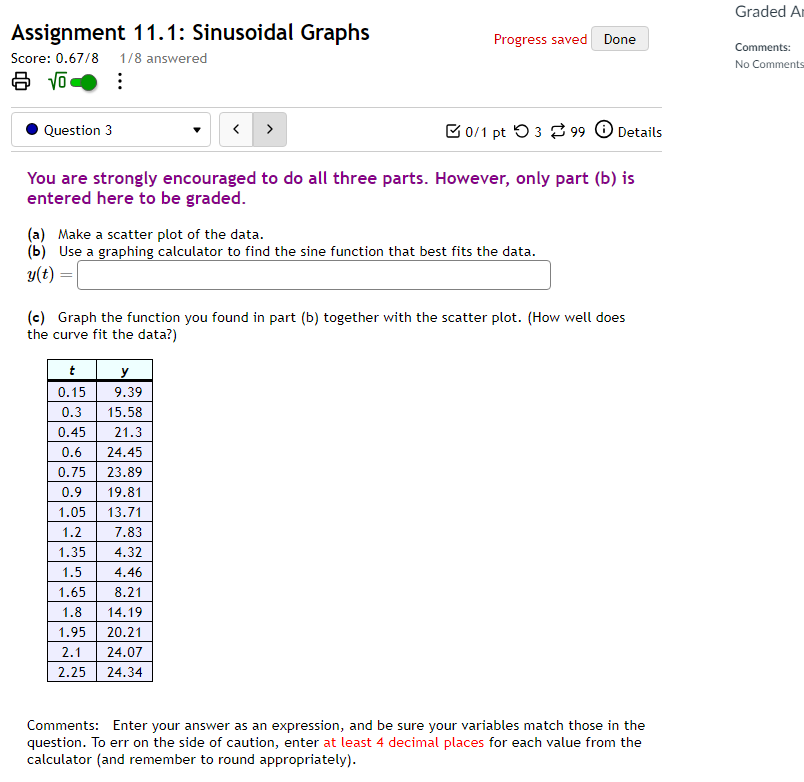
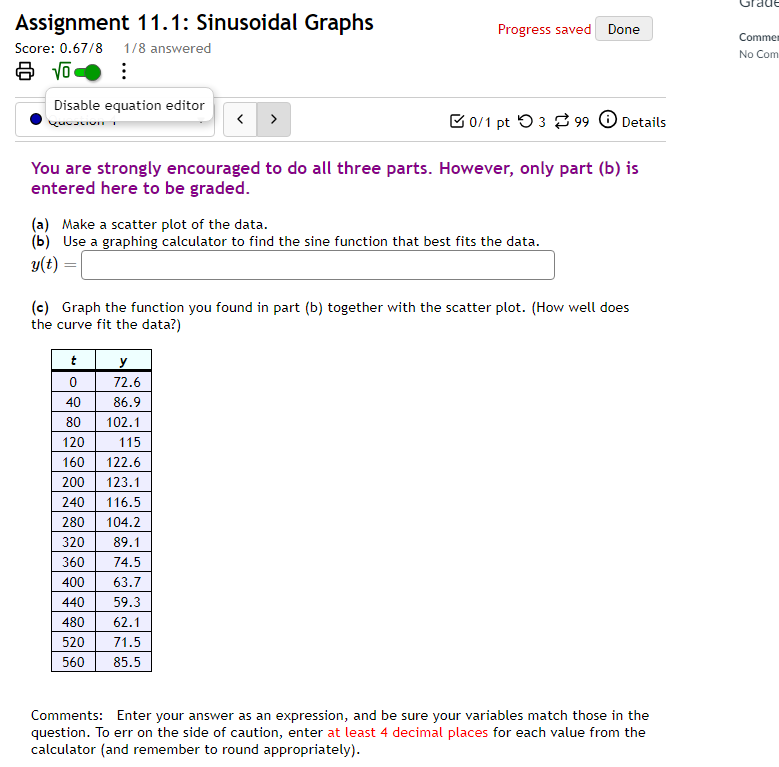
Assignment 11.1: Sinusoidal Graphs Progress saved Done Com Score: 0.67/8 1/8 answered No C $ Vo . . . Question 1 Next question Get a similar question You can retry this question below The displacement of a mass suspended by a spring is modeled by the function h(t) = 7 sin(11nt) Where h(t) is measured in centimeters, and t is measured in seconds Find the: Amplitude: 7 cm Period: 2 X seconds Frequency: 2 HzGraded A Assignment 11.1: Sinusoidal Graphs Progress saved Done Comments: Score: 0.67/8 1/8 answered No Comment $ VOCO Question 3 0/1 pt 0 3 2 99 0 Details You are strongly encouraged to do all three parts. However, only part (b) is entered here to be graded. (a) Make a scatter plot of the data. (b) Use a graphing calculator to find the sine function that best fits the data. y( t) = (c) Graph the function you found in part (b) together with the scatter plot. (How well does the curve fit the data?) 0. 15 9.39 0.3 15.58 0.45 21.3 0.6 24.45 0.75 23.89 0.9 19.81 1.05 13.71 1.2 7.83 1.35 4.37 1.5 4.46 1.65 8.21 1.8 14.19 1.95 20.21 2. 24.07 2.25 24.34 Comments: Enter your answer as an expression, and be sure your variables match those in the question. To err on the side of caution, enter at least 4 decimal places for each value from the calculator (and remember to round appropriately).Assignment 11.1: Sinusoidal Graphs Progress saved Done Commer Score: 0.67/8 1/8 answered No Con VO -. Disable equation editor 0/1 pt 0 3 99 0 Details You are strongly encouraged to do all three parts. However, only part (b) is entered here to be graded. (a) Make a scatter plot of the data. (b) Use a graphing calculator to find the sine function that best fits the data. y(t) = (c) Graph the function you found in part (b) together with the scatter plot. (How well does the curve fit the data?) y 0 72.6 40 86.9 80 102.1 120 115 160 122.6 200 123.1 240 116.5 280 104.2 320 89.1 360 74.5 400 63.7 440 59.3 480 62.1 520 71.5 560 85.5 Comments: Enter your answer as an expression, and be sure your variables match those in the question. To err on the side of caution, enter at least 4 decimal places for each value from the calculator (and remember to round appropriately).Graded A Assignment 11.1: Sinusoidal Graphs Progress saved Done Comments: Score: 0.67/8 1/8 answered No Comment . Question 5
Step by Step Solution
There are 3 Steps involved in it

Get step-by-step solutions from verified subject matter experts