

Question: ASSIGNMENT 2 1. The following table shows the one-year return distribution of Startup, Inc. Probability 40% 20% 20% 10% 10% Return -100%-75%-50%-25% 1000% Calculate a.
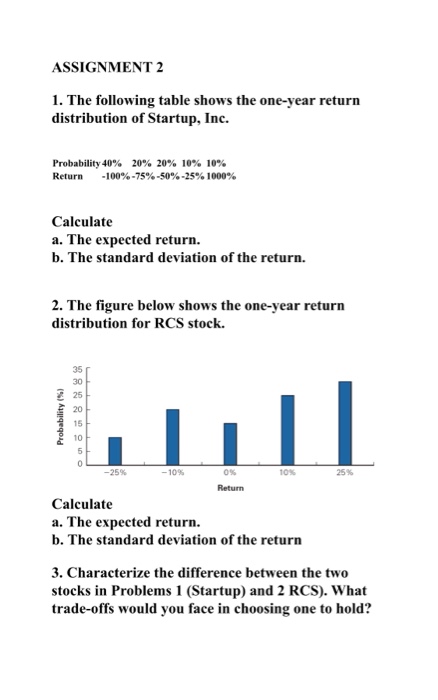
ASSIGNMENT 2 1. The following table shows the one-year return distribution of Startup, Inc. Probability 40% 20% 20% 10% 10% Return -100%-75%-50%-25% 1000% Calculate a. The expected return. b. The standard deviation of the return. 2. The figure below shows the one-year return distribution for RCS stock. 35 30 25 20 15 10 -25% -10% 0% 10% 25% Return Calculate a. The expected return. b. The standard deviation of the return 3. Characterize the difference between the two stocks in Problems 1 (Startup) and 2 RCS). What trade-offs would you face in choosing one to hold
Step by Step Solution
There are 3 Steps involved in it
1 Expert Approved Answer
Step: 1 Unlock

Question Has Been Solved by an Expert!
Get step-by-step solutions from verified subject matter experts
Step: 2 Unlock
Step: 3 Unlock