

Question: Assignment 2 Apple Inc.s Financial Modeling with PlannersLab Objective Following the initial assignment where we used PlannersLab to learn its basic features and components, now
Assignment 2
Apple Inc.s Financial Modeling with PlannersLab
Objective
Following the initial assignment where we used PlannersLab to learn its basic features and components, now we will develop a financial model for Apple Inc. The goal is to create charts that provide us insights of Apples products based on their past performance.
Previous work
In the initial PlannersLab tutorial we had 2019 as the year base and forecasted the following three years. We used growth-rate variables to indicate our assumptions about the percentage growth that we estimated that each product line would have. With these numbers we were able to forecast the number of units for each product line. For example, # of units in 2019 (our year base) times 1.25 (1 + growth-year = 1 + 25%).
New tasks
For this new assignment, we will have three years of data. That is, we will use Apples 10K form, which is an annual report required by the U.S. Securities and Exchange Commission providing a comprehensive summary of a companys financial performance (adapted from Wikipedia). In this case we have data for 2018, 2017, and 2016, and the objective is to forecast 2019 at least. You can continue the forecast for additional years if you choose to do so.
Data required
From the Table of Contents, you want to select Managements Discussion and Analysis of Financial Condition and Results of Operations, and start browsing by scrolling down until you reach the section Sales Data (around Page 26) As you can see, we can obtain Net Sales by Product (middle of the table) and Unit Sales by Product (end of the table) for iPhone, iPad, Mac, Services, and other products. Columns with the title Change just list percentages of increases or decreases from one year to the next (negative percentages decreases are listed within parentheses). In addition, you should continue scrolling down until you find Gross Margin for 2018, 2017, and 2016 (around end of page 29). In this small table you can see again Net Sales, but also you get Cost of Sales per year.
Notes
When reading the 10K form pay close attention to the units used for dollars and product units since they use Millions and Thousands. Make adjustments for these difference in scale so your calculations will not be giving you surprising values (useless values, actually).
For simplicity, you can approximate some of the values, or you can make assumptions. Please include explicit notes highlighting these assumptions/approximations in your submission.
Data Structure
In the initial PlannersLab tutorial assignments we had 4 nodes under Model Design (left side of the screen) listing Sales Volume which contained products units, calculated based on their corresponding growth-rates. Then, we had the Materials Expenses node containing products costs, calculated based on their corresponding cost-increase-factors. Later, we had the Sales Price node containing products price, calculated based on their corresponding price-increase-factors. Finally, we had the Profit Before G&A node where we calculated the profit for each product line. That is,
Profit = Revenue Total Cost
Revenue = Units Sold * Product Price
Total Cost = Units Sold * Product Cost
New Calculations
We will create the same node structure for this assignment following the example from PlannersLab tutorial. Therefore, we need to have the values for the same type of variables: product unit growth-rates, calculate product units (only 2019 calculation is required), product costs increase-factors, calculate product costs, product price increase-factors, calculate product prices, and profits calculations for all products.
Data Preparation
So, consider Apples main products: iPhone, iPad, and Mac. Create an Excel worksheet listing 2016, 2017, 2018 values so you can plan the data you will use for PlannersLab. As mentioned before, you already have Unit Sales, and you need to calculate product prices and product costs. Product unit prices can be estimated by dividing Net Sales by Unit Sales.
Now, calculating product unit costs would be a bit trickier. One way to go around the problems is to calculate it as follow: ((net sales/total net sales) * total cost of sales) / unit sales. Note that the above may oversimplify your calculations. The goal is to approximate the unit cost by calculating the contribution of the net sales of a given product group in the total net sales.
Entering New Data
Once you have all values for the initial three nodes (Sales Volume, Materials Expenses, and Sales Price) you can enter the values in Planners Lab following the same process used in the initial PlannersLab tutorial. Create the four nodes, enter all the variables (in this case for Apples four main products), the same way described in the tutorial including profit calculations within Profit Before G&A node.
Notice that growth-rates, cost-increase-rates, and price-increase-rates for 2019 should be estimated. You can decide to average previous values, or decide based on the economy that these rates should be higher or lower. Just provide all your assumptions highlighting them in your submission.
New Insights
Once you complete Modeling, go to Playground in PlannersLab, and look to create charts that can provide answers to the questions listed below. Choose among line and bar charts depending on what you consider better illustrate an answer.
Action
Copy each question in a Word file, add the screenshot of all corresponding charts, and mainly provide an explanation based on the charts values about what we can learn from them toward answering the following points:
- Investigate your current profits from different product lines (use a line chart and use all goal variables in your drawing, except the total profit). Interpret the results. Save the layout.
- Assess sales volume data. Use a chart to document your findings. What are your best selling products in terms of units sold? Do you find any similarities or differences between profits and units sold?
- Based on the information obtained from questions 1 and 2, Are there any products for which the profits are expected to decline?
- What would it take to double the profits on your least profitable product group? Before you can answer the question, you should examine which variables the profit depends on. To do that, while in Playground mode, create a new layout and drag a Variable-Tree onto it. Next, add the desired goal variable to the tree and then choose year 2019 (your first forecast year). Expand all branches. You should see that profits depend on three factors: sales growth rate, cost increase factor, and price increase factor.
- Lets assume that our goal is to double the profit on our worst selling product. First, lets use Goal Seek chart to determine how our goal can be reached. Create a new layout, name it Goal Seek, and drag a Goal Seek line chart to the stage as well as a regular line chart. Populate the Goal Seek chart with the profit variable for your least profitable product as well as the sales growth rate for that product. Populate the line chart with just the sales growth rate for the product. Drag the goal seek line for the profit to indicate how the sales growth rate would need to change in order to reach our goal.
- Examine the line chart, point the mouse over the What-If Case. How much the sales growth rate would need to change in order to achieve our goal?
- So far, we know that three factors can influence our profits (see question 4). Lets use the Impact Analysis tool how the three what if variables contribute to our products profit. Create a new layout and add Impact Analysis chart onto it. Populate it with the profit variable for your product, and the three What-If variables for the product (from question 4). Adjust the year to your first forecast year (2019). You should see which variable has the strongest impact on the products profit. Keep in mind that our analysis doesnt account for the economic factors outside of our organization (for example, increasing the price may eventually result in reduced sales volume).
- If the variable identified in question-7 is the same as the one in question-5. State your recommendation. Otherwise, repeat question-5 and question-6 for the variable identified in question-7 and state your recommendation. You can apply the changes to the model by clicking Apply to Model button.
- Lets assume that one of your suppliers is expected to increase the price of materials for one of your products in the near future. You decide to examine how it will affect your profits. Create a new layout and drop a What-If chart and a line chart onto it. Populate the What-If chart with the cost increase factor for one of the products. Drag Total profit onto the regular line chart. How much would the total profit change if the cost of your materials increased by 10%?
Submission Guidelines
- Submit Planners Lab file for your model ( with the file name extension .plm). Make sure that any charts that you created are saved in proper layouts.
- Report all the assumptions that you have made when extracting information from the financial statement.
- A Word document including the answers for all questions. Make sure that you clearly state your answer. Also, state any assumptions that you have made when answering the question. Include screenshots from Planners Lab that support your findings. HINT: when pasting a screenshot, make sure that it is properly cropped and resized. I will not grade something I cant read without a magnifying glass. Think of your submission as a report that you may end up submitting to your boss. Make sure the important information is emphasized and that the content is presented in a clean manner.
- Include the Excel file you used to outline all initial values (the one indicated in Data Preparation section, above)
- Submit your THREE files (PlannersLab, Word, and Excel file) in CANVAS. You can include any additional information you deem important.
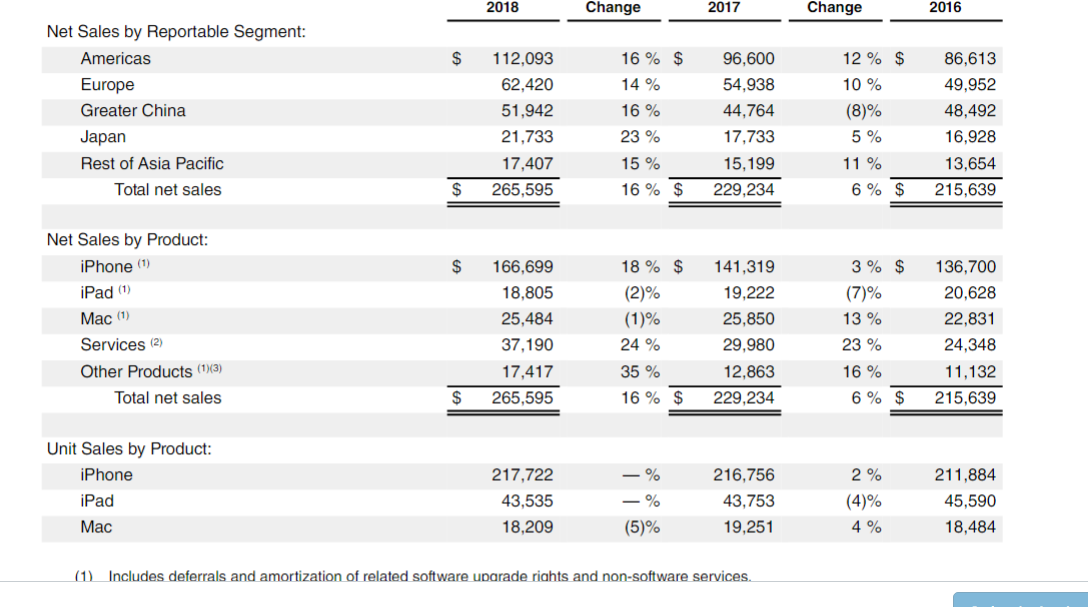
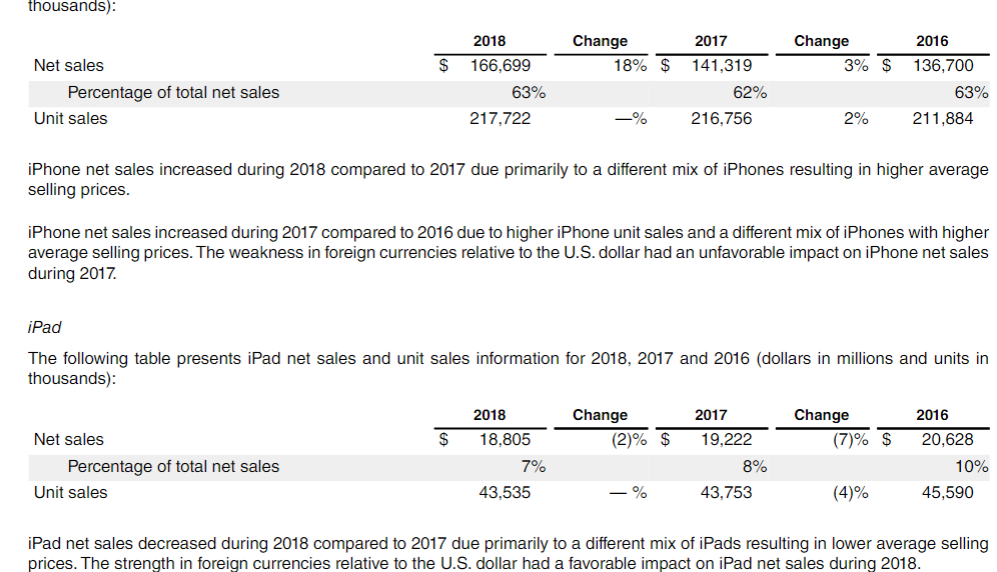
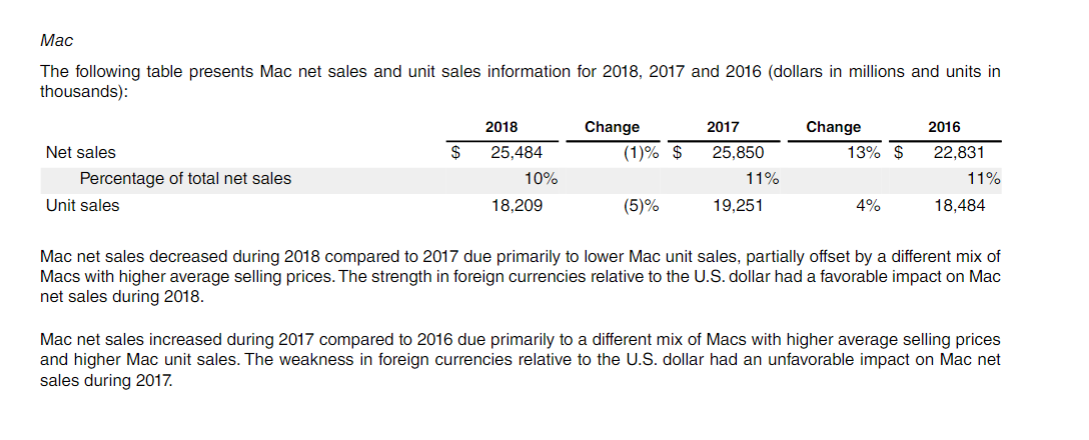
11) Inciudes deterrais and amortization of reiated sortware ubarade riants and non-sortware services. iPhone net sales increased during 2018 compared to 2017 due primarily to a different mix of iPhones resulting in higher average selling prices. iPhone net sales increased during 2017 compared to 2016 due to higher iPhone unit sales and a different mix of iPhones with higher average selling prices. The weakness in foreign currencies relative to the U.S. dollar had an unfavorable impact on iPhone net sales during 2017. iPad The following table presents iPad net sales and unit sales information for 2018,2017 and 2016 (dollars in millions and units in thousands): iPad net sales decreased during 2018 compared to 2017 due primarily to a different mix of iPads resulting in lower average selling prices. The strength in foreign currencies relative to the U.S. dollar had a favorable impact on iPad net sales during 2018. Mac The following table presents Mac net sales and unit sales information for 2018 , 2017 and 2016 (dollars in millions and units in thousands): Mac net sales decreased during 2018 compared to 2017 due primarily to lower Mac unit sales, partially offset by a different mix of Macs with higher average selling prices. The strength in foreign currencies relative to the U.S. dollar had a favorable impact on Mac net sales during 2018. Mac net sales increased during 2017 compared to 2016 due primarily to a different mix of Macs with higher average selling prices and higher Mac unit sales. The weakness in foreign currencies relative to the U.S. dollar had an unfavorable impact on Mac net sales during 2017. 11) Inciudes deterrais and amortization of reiated sortware ubarade riants and non-sortware services. iPhone net sales increased during 2018 compared to 2017 due primarily to a different mix of iPhones resulting in higher average selling prices. iPhone net sales increased during 2017 compared to 2016 due to higher iPhone unit sales and a different mix of iPhones with higher average selling prices. The weakness in foreign currencies relative to the U.S. dollar had an unfavorable impact on iPhone net sales during 2017. iPad The following table presents iPad net sales and unit sales information for 2018,2017 and 2016 (dollars in millions and units in thousands): iPad net sales decreased during 2018 compared to 2017 due primarily to a different mix of iPads resulting in lower average selling prices. The strength in foreign currencies relative to the U.S. dollar had a favorable impact on iPad net sales during 2018. Mac The following table presents Mac net sales and unit sales information for 2018 , 2017 and 2016 (dollars in millions and units in thousands): Mac net sales decreased during 2018 compared to 2017 due primarily to lower Mac unit sales, partially offset by a different mix of Macs with higher average selling prices. The strength in foreign currencies relative to the U.S. dollar had a favorable impact on Mac net sales during 2018. Mac net sales increased during 2017 compared to 2016 due primarily to a different mix of Macs with higher average selling prices and higher Mac unit sales. The weakness in foreign currencies relative to the U.S. dollar had an unfavorable impact on Mac net sales during 2017
Step by Step Solution
There are 3 Steps involved in it

Get step-by-step solutions from verified subject matter experts