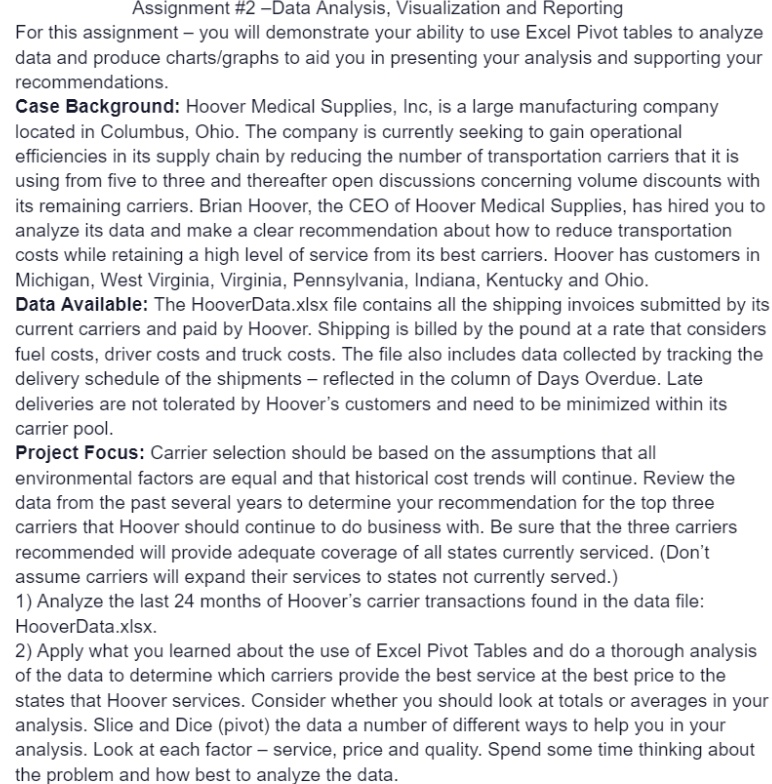
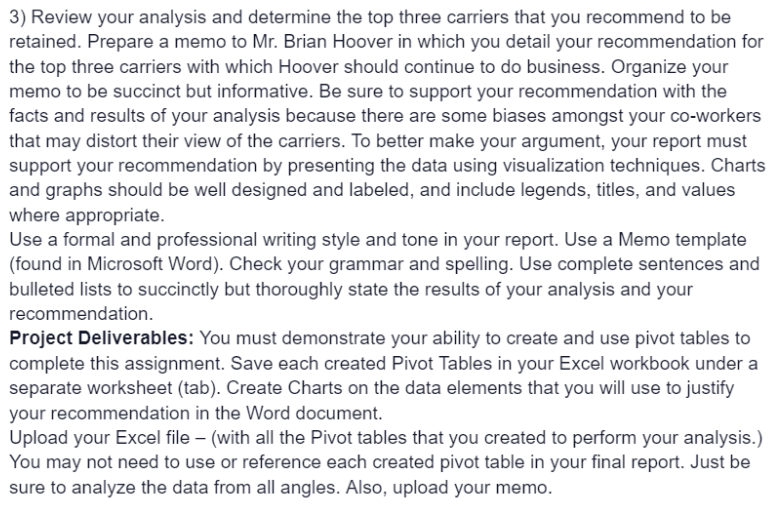
Question: Assignment #2 Data Analysis, Visualization and Reporting For this assignment you will demonstrate your ability to use Excel Pivot tables to analyze data and produce

Assignment #2 Data Analysis, Visualization andAssignment #2 Data Analysis, Visualization and
Assignment #2 Data Analysis, Visualization and Reporting For this assignment you will demonstrate your ability to use Excel Pivot tables to analyze data and produce chartsigraphs to aid you in presenting your analysis and supporting your recommendations. Case Background: Hoover Medical Supplies, Inc, is a large manufacturing company located in Columbus, Ohio. The company is currently seeking to gain operational efciencies in its supply chain by reducing the number of transportation carriers that it is using from ve to three and thereafter open discussions concerning volume discounts with its remaining carriers. Brian Hoover, the CEO of Hoover Medical Supplies, has hired you to analyze its data and make a clear recommendation about how to reduce transportation costs while retaining a high level of service from its best carriers. Hoover has customers in Michigan, West Virginia, Virginia, Pennsylvania, Indiana, Kentucky and Ohio. Data Available: The HooverData.xlsx file contains all the shipping invoices submitted by its current carriers and paid by Hoover. Shipping is billed by the pound at a rate that considers fuel costs. driver costs and truck costs. The le also includes data collected by tracking the delivery schedule of the shipments reflected in the column of Days Overdue. Late deliveries are not tolerated by Hoover's customers and need to be minimized within its carrier pool. Project Focus: Carrier selection should be based on the assumptions that all environmental factors are equal and that historical cost trends will continue. Review the data from the past several years to determine your recommendation for the top three carriers that Hoover should continue to do business with. Be sure that the three carriers recommended will provide adequate coverage of all states currently serviced. (Don't assume carriers will expand their services to states not currently served.) 1) Analyze the last 24 months of Hoover's carrieir transactions found in the data le: HooverData.xisx. 2) Apply what you learned about the use of Excel Pivot Tables and do a thorough analysis of the data to determine which carriers provide the best service at the best price to the states that Hoover services. Consider whether you should look at totals or averages in your analysis. Slice and Dice (pivot) the data a number of different ways to heip you in your analysis. Look at each factor service, price and quality. Spend some time thinking about the problem and how best to analyze the data. 3) Review your analysis and determine the top three carriers that you recommend to be retained. Prepare a memo to Mr. Brian Hoover in which you detail your recommendation for the top three carriers with which Hoover should continue to do business. Organize your memo to be succinct but informative. Be sure to support your recOmmendation with the facts and results of your analysis because there are some biases amongst your co-workers that may distort their view of the carriers. To better make your argument, your report must support your recommendation by presenting the data using visualization techniques. Charts and graphs shouid be well designed and labeled, and include legends, titles, and values where appropriate. Use a formal and professional writing style and tone in your report. Use a Memo template (found in Microsoft Word). Check your grammar and spelling. Use complete sentences and bulleted lists to succinctly but thoroughly state the results of your analysis and your recommendation. Project Dellverables: You must demonstrate your ability to create and use pivot tables to complete this assignment. Save each created Pivot Tabfes in your Excel workbook under a separate worksheet (tab). Create Charts on the data elements that you will use to justify your recommendation in the Word document. Upload your Excel file (with all the Pivot tables that you created to perform your analysis.) You may not need to use or reference each created pivot table in your final report. Just be sure to analyze the data from all angles. Also, upload your memo

Step by Step Solution

There are 3 Steps involved in it

1 Expert Approved Answer
Step: 1 Unlock blur-text-image
Question Has Been Solved by an Expert!

Get step-by-step solutions from verified subject matter experts

Step: 2 Unlock
Step: 3 Unlock

Students Have Also Explored These Related General Management Questions!