

Question: Assignment 2 - Forecasting Background: Wes and Steve are partners in a lunch truck company that operates a central kitchen and operates lunch trucks that
Assignment Forecasting
Background: Wes and Steve are partners in a lunch truck company that operates a central kitchen and operates lunch trucks
that travel to various locations in Philadelphia, MondayFriday. The lunch trucks deliver prepackaged healthy sandwich and
salad alternatives, fresh fruit and prepackaged lowfat desserts and canned beverages. Together, the partners have to make
many decisions about how to structure the operational aspects of the business so that it is cost effective, efficient and
profitable.
Current Situation: Steve and Wes know they must prepareuse forecasts to make effective decisions for the business. They
are presently faced with situations for analyzingpreparing forecast data:
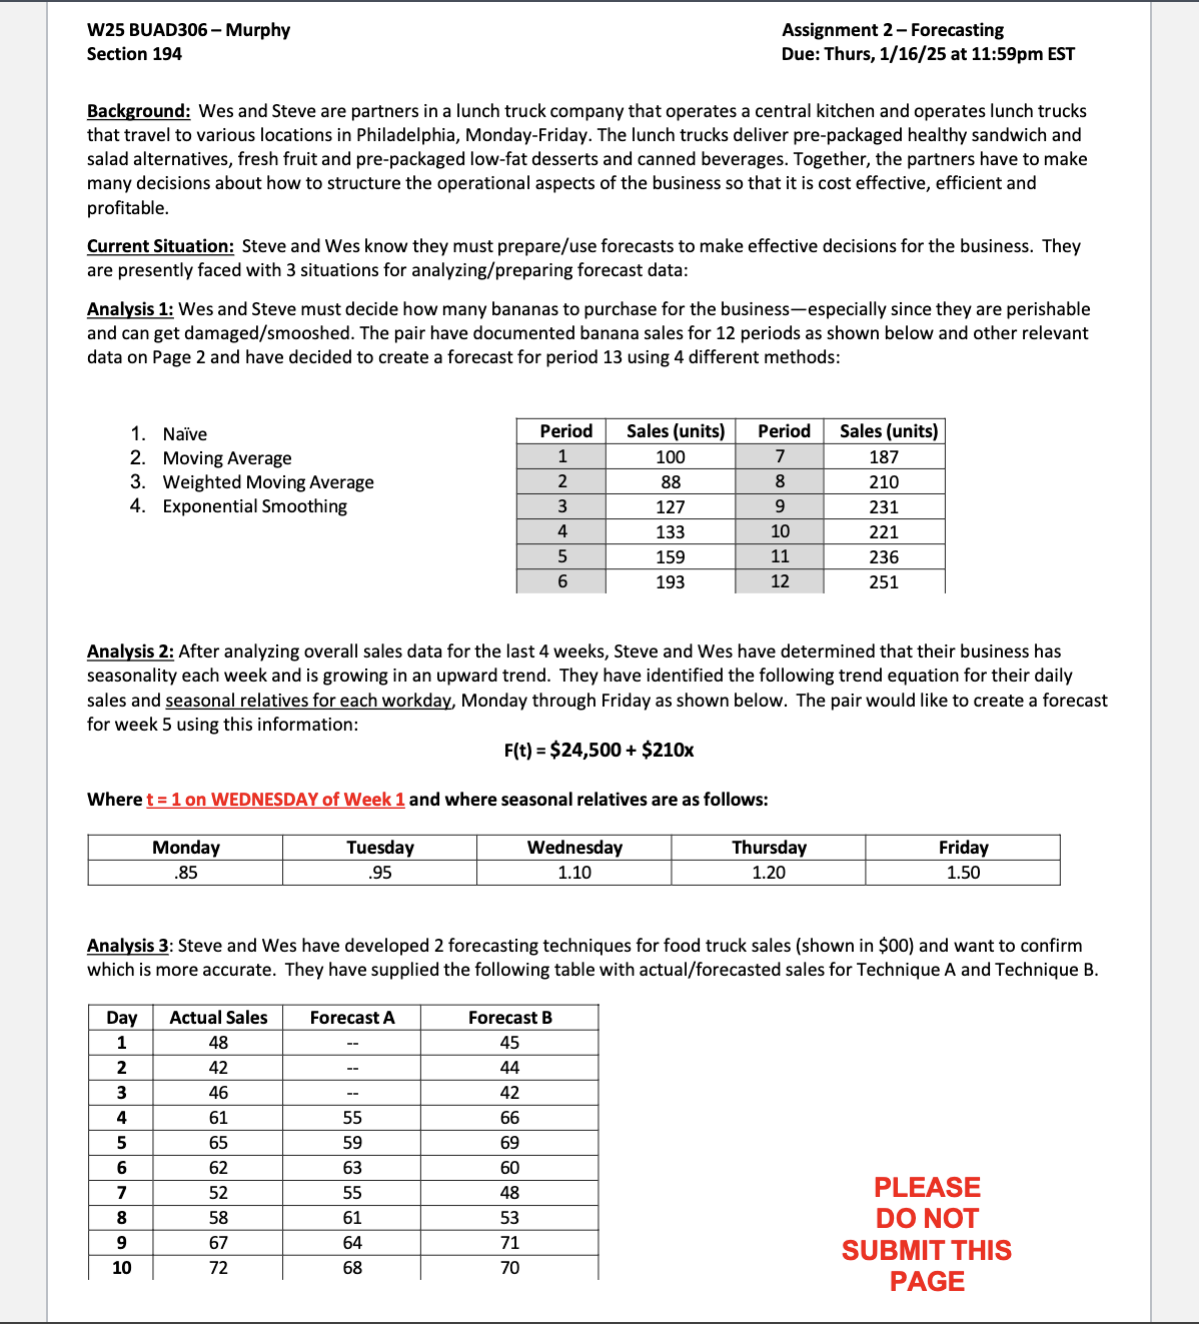
Analysis : Wes and Steve must decide how many bananas to purchase for the businessespecially since they are perishable
and can get damagedsmooshed The pair have documented banana sales for periods as shown below and other relevant
data on Page and have decided to create a forecast for period using different methods:
Nave
Moving Average
Weighted Moving Average
Exponential Smoothing
Analysis : After analyzing overall sales data for the last weeks, Steve and Wes have determined that their business has
seasonality each week and is growing in an upward trend. They have identified the following trend equation for their daily
sales and seasonal relatives for each workday, Monday through Friday as shown below. The pair would like to create a forecast
for week using this information:
Ft$$ x
Where t on WEDNESDAY of Week and where seasonal relatives are as follows:
Analysis : Steve and Wes have developed forecasting techniques for food truck sales shown in $ and want to confirm
which is more accurate. They have supplied the following table with actualforecasted sales for Technique A and Technique B
PLEASE
DO NOT
SUBMIT THIS
PAGE
Instructions: Print this page, reproduce by hand or complete via computer. Regardless, you must note answers in the box
provided ONLY. All supporting math must be shown in the corresponding spacerounding answers to decimal points. If
you write an answer and math is not included or does not correspond, you will receive no points. Note: You must write
neatly. If I cannot read it you will receive zero points. Per instructions, do NOT cross out work; use white out or redo!
When completed: Take a photo of this pagesave file and upload via the corresponding Assignment link in Canvas by the due
date. Remember: No HEIC files are permitted. No red ink!
ANALYSIS Use data provided on Page
Nave Forecast
Math must show:
For answers, only include #s
No verbiage. I will look to left for
supporting info.
Answer:
pts
Rationale must state in sentence:
Four Period Moving Average PMA
Math must show:
Answer:
pts
Answer:
pts
Answer:
pts
ANALYSIS Use data provided on Page
Create the relevant Ttable for solving Analysis : pts
What is the forecast for each weekday of Week you must include math: pts
ANALYSIS Use data provided on Page
With the data provided, calculate MAD and MSE for each forecasting technique no need to convert to $: pts
Step by Step Solution
There are 3 Steps involved in it
1 Expert Approved Answer
Step: 1 Unlock

Question Has Been Solved by an Expert!
Get step-by-step solutions from verified subject matter experts
Step: 2 Unlock
Step: 3 Unlock