

Question: Assignment 2: Measures of Central Tendency and Variability (20 points) 1. The table below shows the number of years served for 2 groups of upcoming
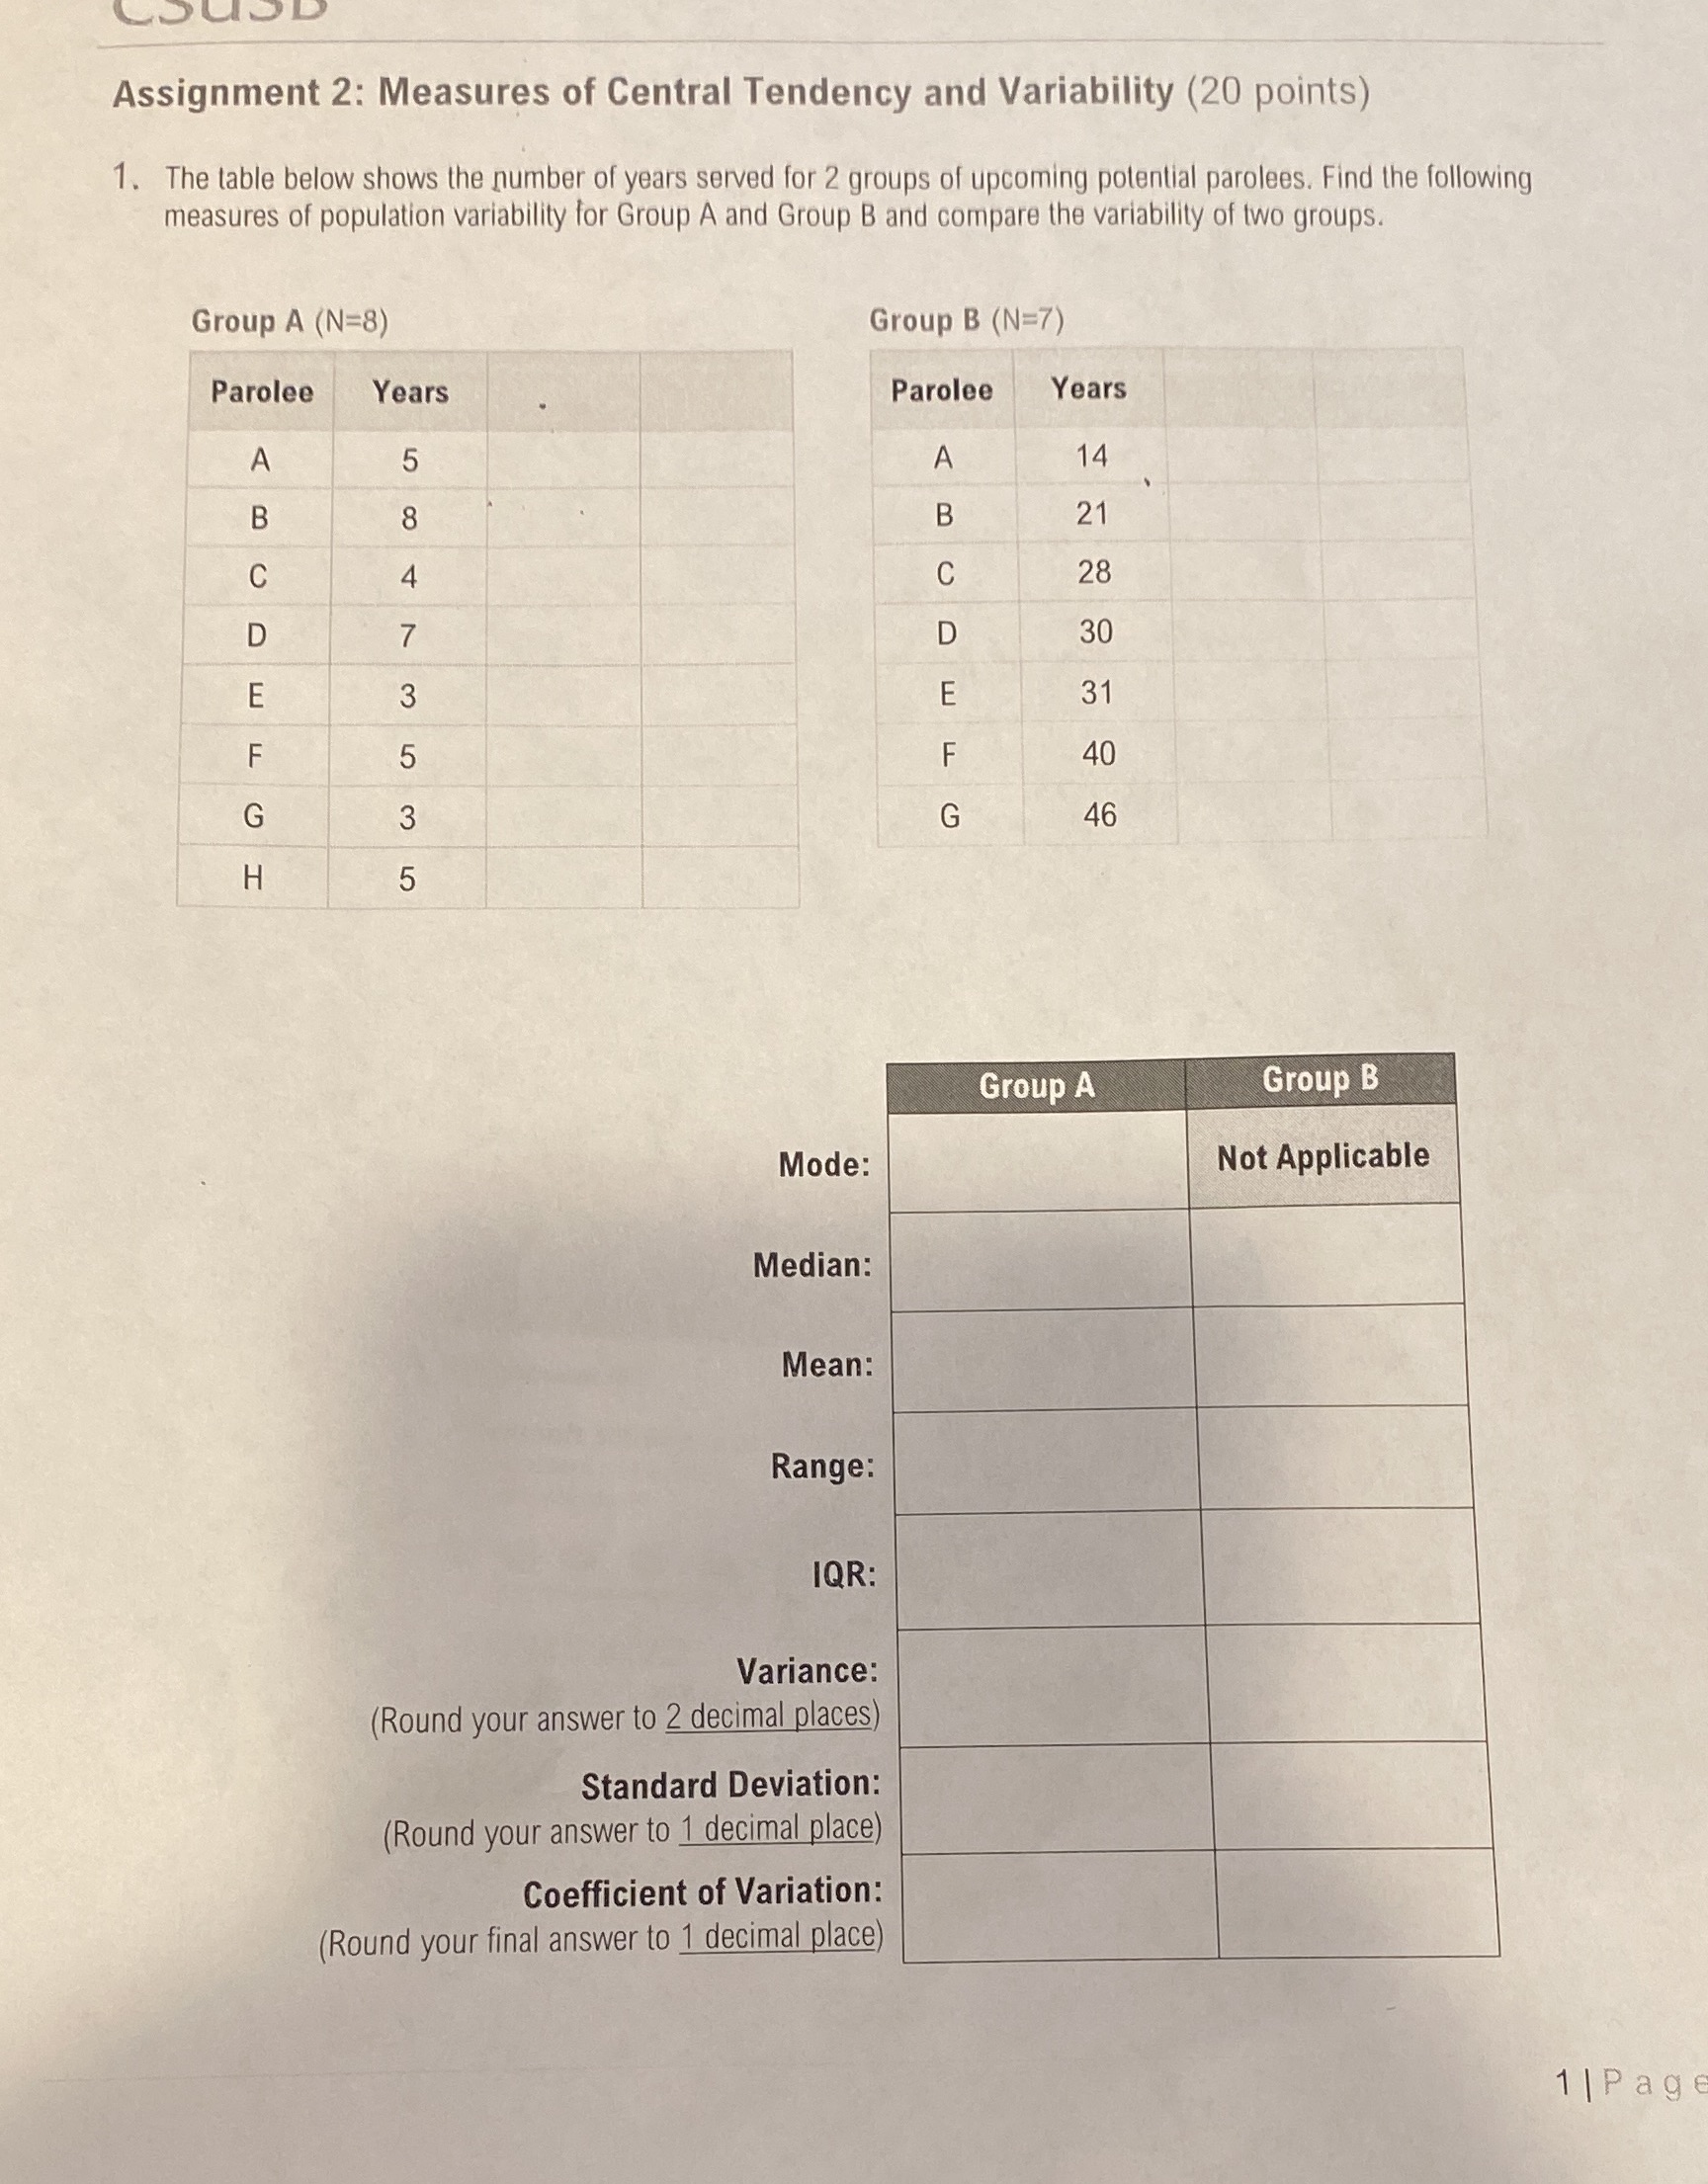

Assignment 2: Measures of Central Tendency and Variability (20 points) 1. The table below shows the number of years served for 2 groups of upcoming potential parolees. Find the following measures of population variability for Group A and Group B and compare the variability of two groups. Group A (N=8) Group B (N=7) Parolee Years Parolee Years A 5 A 14 B 8 B 21 C A C 28 D D 30 E E 31 40 G w 46 H 5 Group A Group B Mode: Not Applicable Median: Mean: Range: IQR: Variance: Round your answer to 2 decimal places Standard Deviation: (Round your answer to 1 decimal place Coefficient of Variation: (Round your final answer to 1 decimal place 1|Page
Step by Step Solution
There are 3 Steps involved in it

Get step-by-step solutions from verified subject matter experts