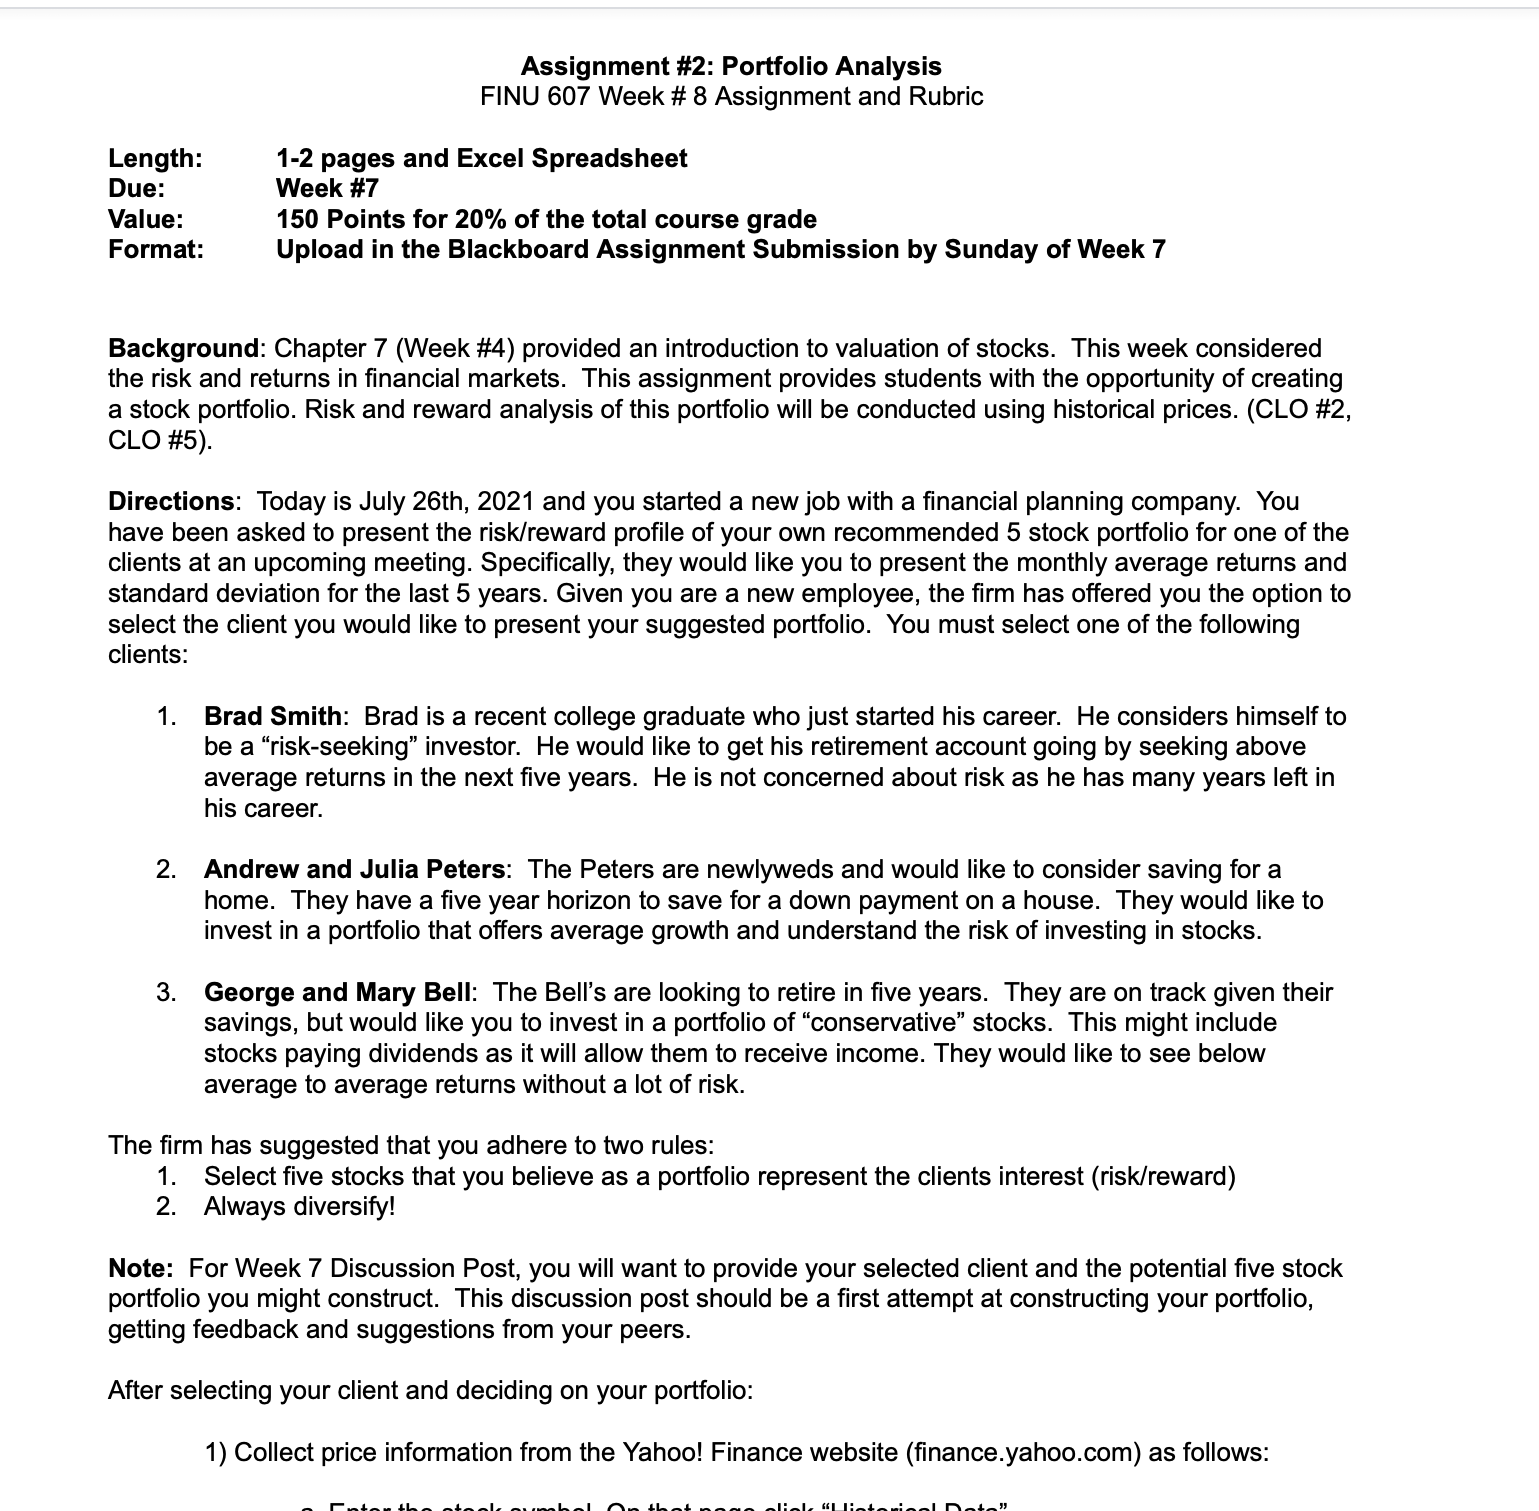
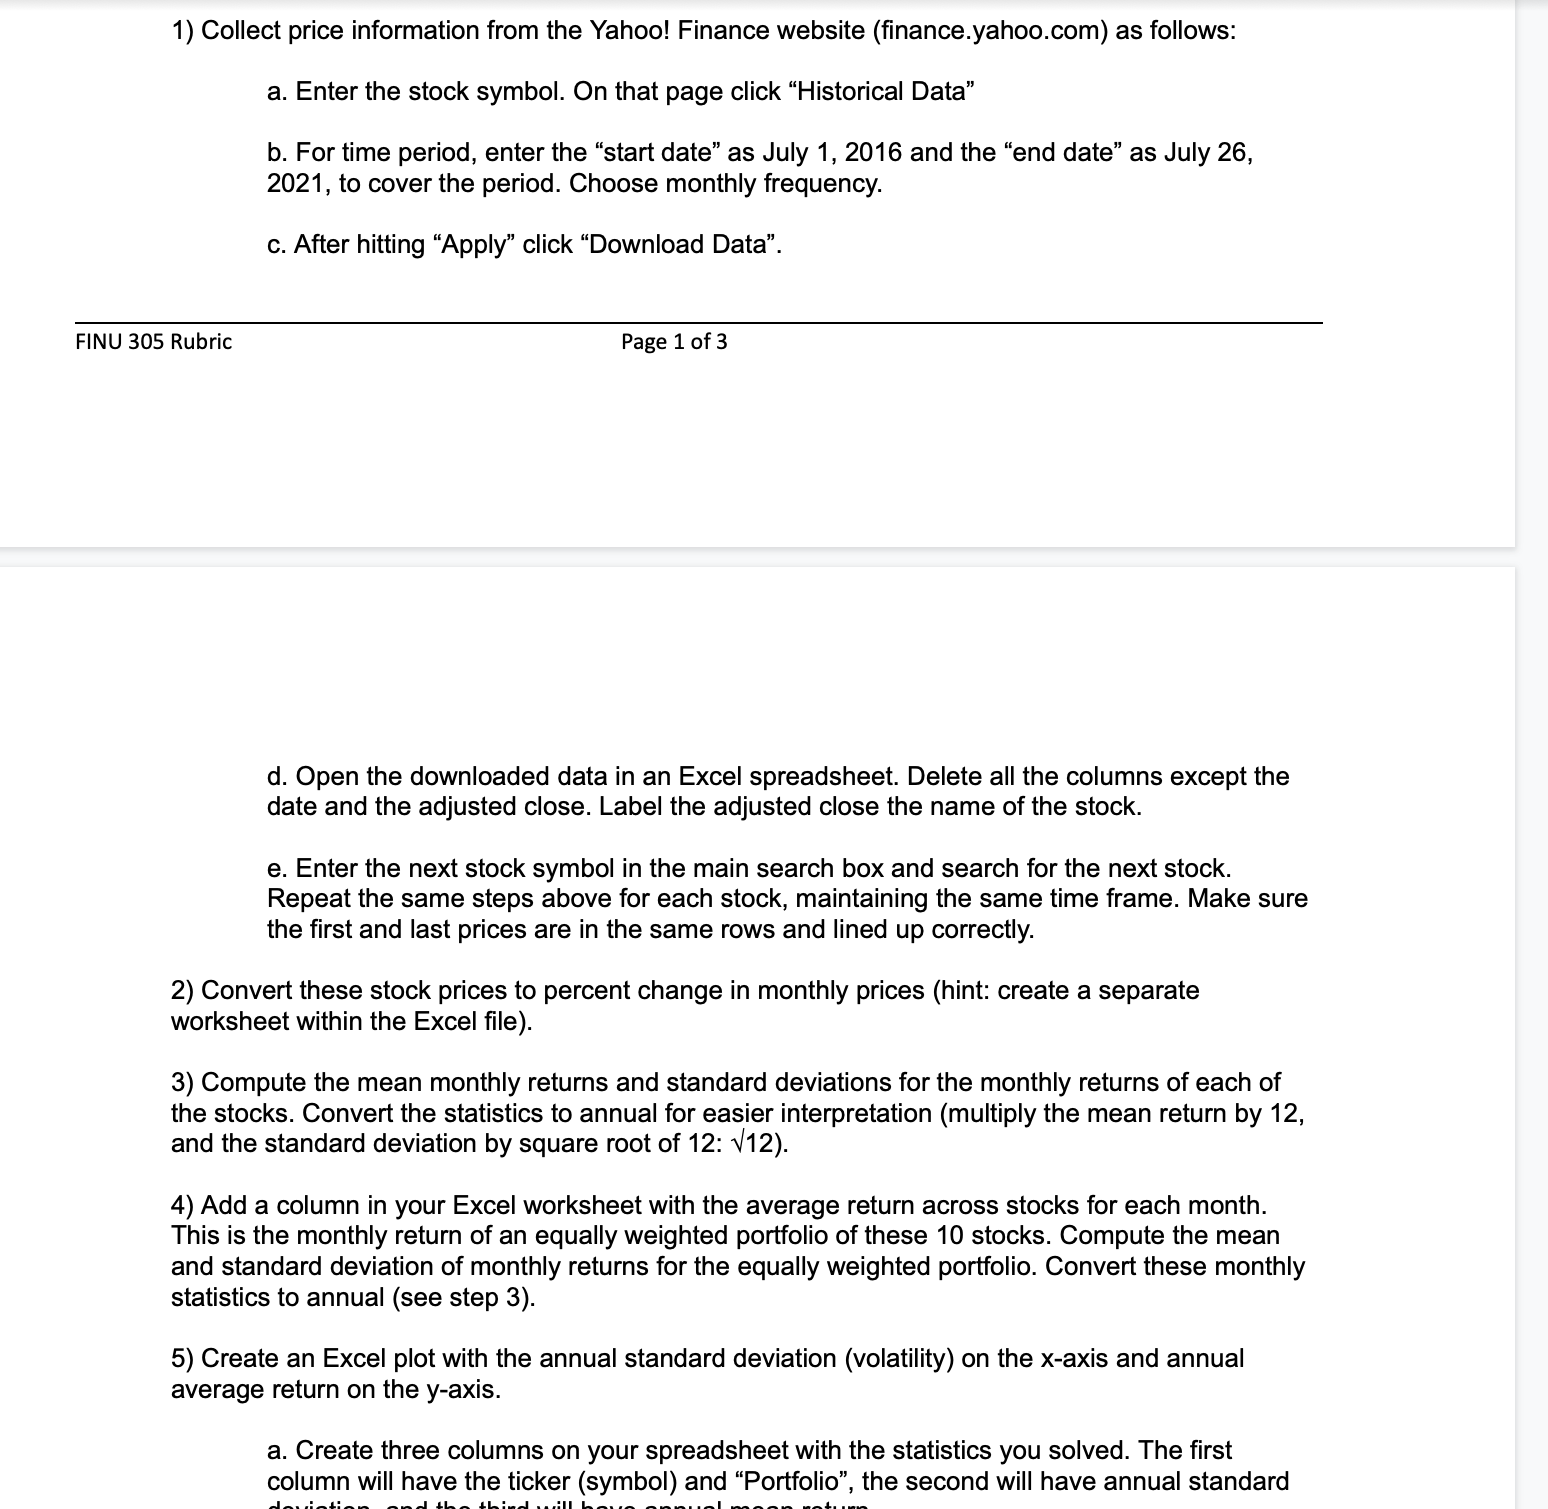
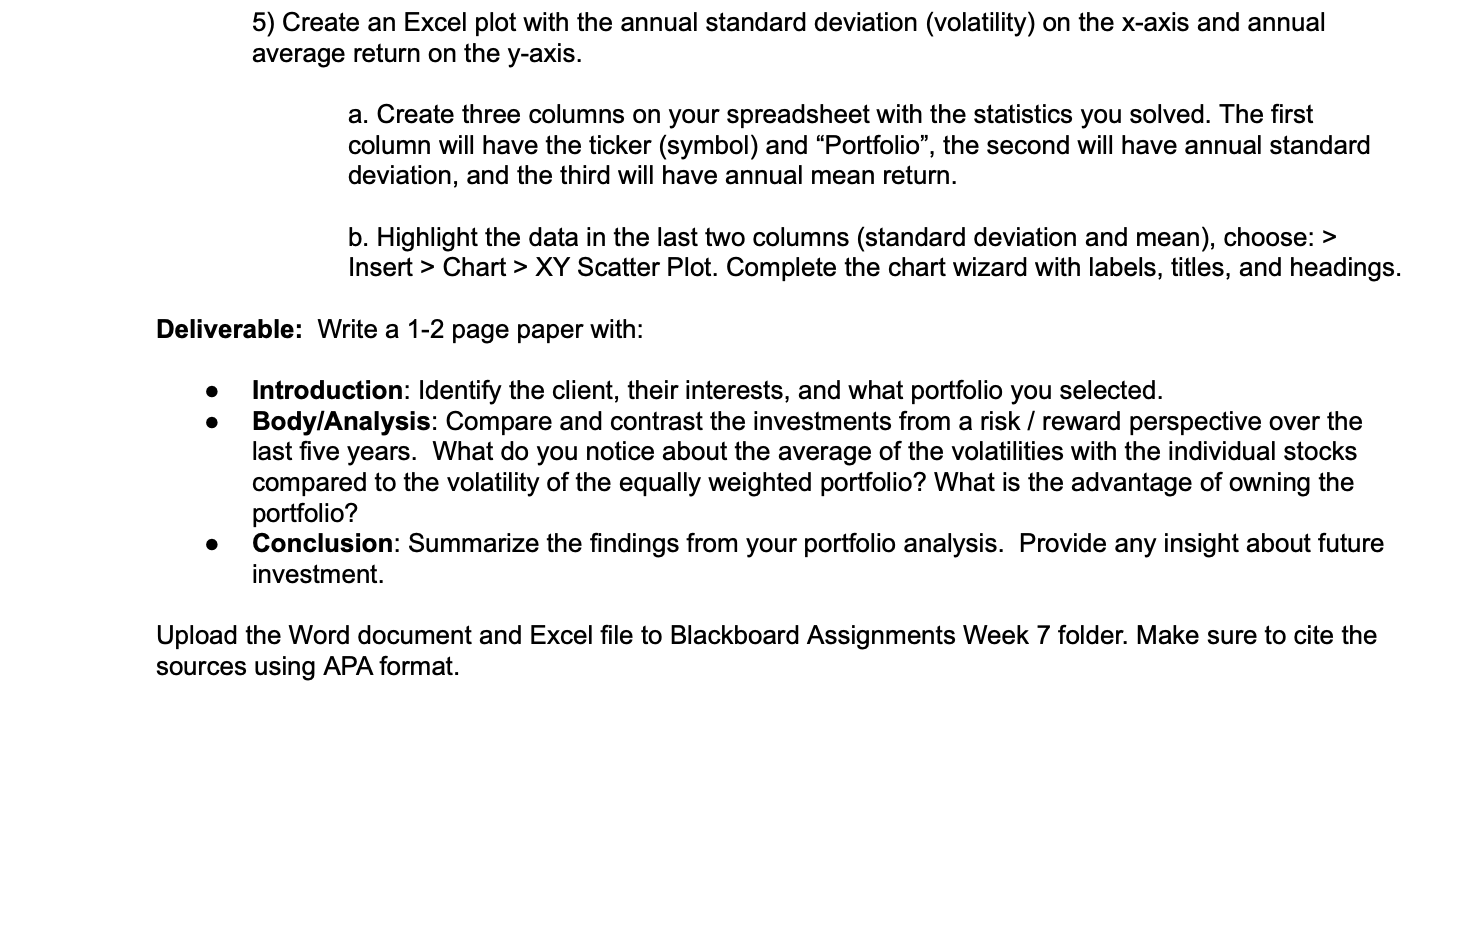
Question: Assignment #2: Portfolio Analysis FINU 607 Week # 8 Assignment and Rubric Length: 1-2 pages and Excel Spreadsheet Due: Week #7 Value: 150 Points for

Assignment #2: Portfolio Analysis FINU 607 Week #Assignment #2: Portfolio Analysis FINU 607 Week #Assignment #2: Portfolio Analysis FINU 607 Week #
Assignment #2: Portfolio Analysis FINU 607 Week # 8 Assignment and Rubric Length: 1-2 pages and Excel Spreadsheet Due: Week #7 Value: 150 Points for 20% of the total course grade Format: Upload in the Blackboard Assignment Submission by Sunday of Week 7 Background: Chapter 7 (Week #4) provided an introduction to valuation of stocks. This week considered the risk and returns in nancial markets. This assignment provides students with the opportunity of creating a stock portfolio. Risk and reward analysis of this portfolio will be conducted using historical prices. (CLO #2, CLO #5). Directions: Today is July 26th, 2021 and you started a new job with a nancial planning company. You have been asked to present the risk/reward profile of your own recommended 5 stock portfolio for one of the clients at an upcoming meeting. Specifically, they would like you to present the monthly average returns and standard deviation for the last 5 years. Given you are a new employee, the rm has offered you the option to select the client you would like to present your suggested portfolio. You must select one of the following clients: 1. Brad Smith: Brad is a recent college graduate who just started his career. He considers himself to be a \"riskseeking\" investor. He would like to get his retirement account going by seeking above average returns in the next ve years. He is not concerned about risk as he has many years left in his career. 2. Andrew and Julia Peters: The Peters are newlyweds and would like to consider saving for a home. They have a ve year horizon to save for a down payment on a house. They would like to invest in a portfolio that offers average growth and understand the risk of investing in stocks. 3. George and Mary Bell: The Bell's are looking to retire in ve years. They are on track given their savings. but would like you to invest in a portfolio of \"conservative" stocks. This might include stocks paying dividends as it will allow them to receive income. They would like to see below average to average returns without a lot of risk. The rm has suggested that you adhere to two rules: 1. Select five stocks that you believe as a portfolio represent the clients interest (risk/reward) 2. Always diversify! Note: For Week 7 Discussion Post, you will want to provide your selected client and the potential ve stock portfolio you might constmct. This discussion post should be a first attempt at constructing your portfolio. getting feedback and suggestions from your peers. After selecting your client and deciding on your portfolio: 1) Collect price information from the Yahoo! Finance website (nance.yahoo.com) as follows: ._ I-_I._..1L__ _I.__I. _.._..I.__I n... lLl ....___ _I:_I. I II_I__I_._I hL_\" 1) Collect price information from the Yahoo! Finance website (nance.yahoo.com) as follows: a. Enter the stock symbol. On that page click \"Historical Data\" b. For time period, enter the \"start date" as July 1, 2016 and the \"end date" as July 26, 2021, to cover the period. Choose monthly frequency. c. After hitting "Apply" click \"Download Data\". FINU 305 Rubric Page 1 of 3 d. Open the downloaded data in an Excel spreadsheet. Delete all the columns except the date and the adjusted close. Label the adjusted close the name of the stock. 9. Enter the next stock symbol in the main search box and search for the next stock. Repeat the same steps above for each stock, maintaining the same time frame. Make sure the first and last prices are in the same rows and lined up correctly. 2) Convert these stock prices to percent change in monthly prices (hint: create a separate worksheet within the Excel le). 3) Compute the mean monthly returns and standard deviations for the monthly returns of each of the stocks. Convert the statistics to annual for easier interpretation (multiply the mean return by 12, and the standard deviation by square root of 12: v12). 4) Add a column in your Excel worksheet with the average return across stocks for each month. This is the monthly return of an equally weighted portfolio of these 10 stocks. Compute the mean and standard deviation of monthly returns for the equally weighted portfolio. Convert these monthly statistics to annual (see step 3). 5) Create an Excel plot with the annual standard deviation (volatility) on the x-axis and annual average return on the yaxis. a. Create three columns on your spreadsheet with the statistics you solved. The first column will have the ticker (symbol) and "Portfolio\5) Create an Excel plot with the annual standard deviation (volatility) on the xaxis and annual average return on the y-axis. a. Create three columns on your spreadsheet with the statistics you solved. The first column will have the ticker (symbol) and \"Portfolio", the second will have annual standard deviation, and the third will have annual mean return. b. Highlight the data in the last two columns (standard deviation and mean), choose: > Insert > Chart > XY Scatter Plot. Complete the chart wizard with labels, titles, and headings. Deliverable: Write a 1-2 page paper with: 0 Introduction: Identify the client. their interests, and what portfolio you selected. 0 BodyIAnalysis: Compare and contrast the investments from a risk I reward perspective over the last ve years. What do you notice about the average of the volatilities with the individual stocks compared to the volatility of the equally weighted portfolio? What is the advantage of owning the portfolio? 0 Conclusion: Summarize the ndings from your portfolio analysis. Provide any insight about future investment. Upload the Word document and Excel le to Blackboard Assignments Week 7 folder. Make sure to cite the sources using APA format

Step by Step Solution

There are 3 Steps involved in it

1 Expert Approved Answer
Step: 1 Unlock blur-text-image
Question Has Been Solved by an Expert!

Get step-by-step solutions from verified subject matter experts

Step: 2 Unlock
Step: 3 Unlock

Students Have Also Explored These Related Finance Questions!