

Question: Assignment 2: Problem 6 (1 point) Samuel has two different methods to make money off of the stock market, but he doesn't know which method
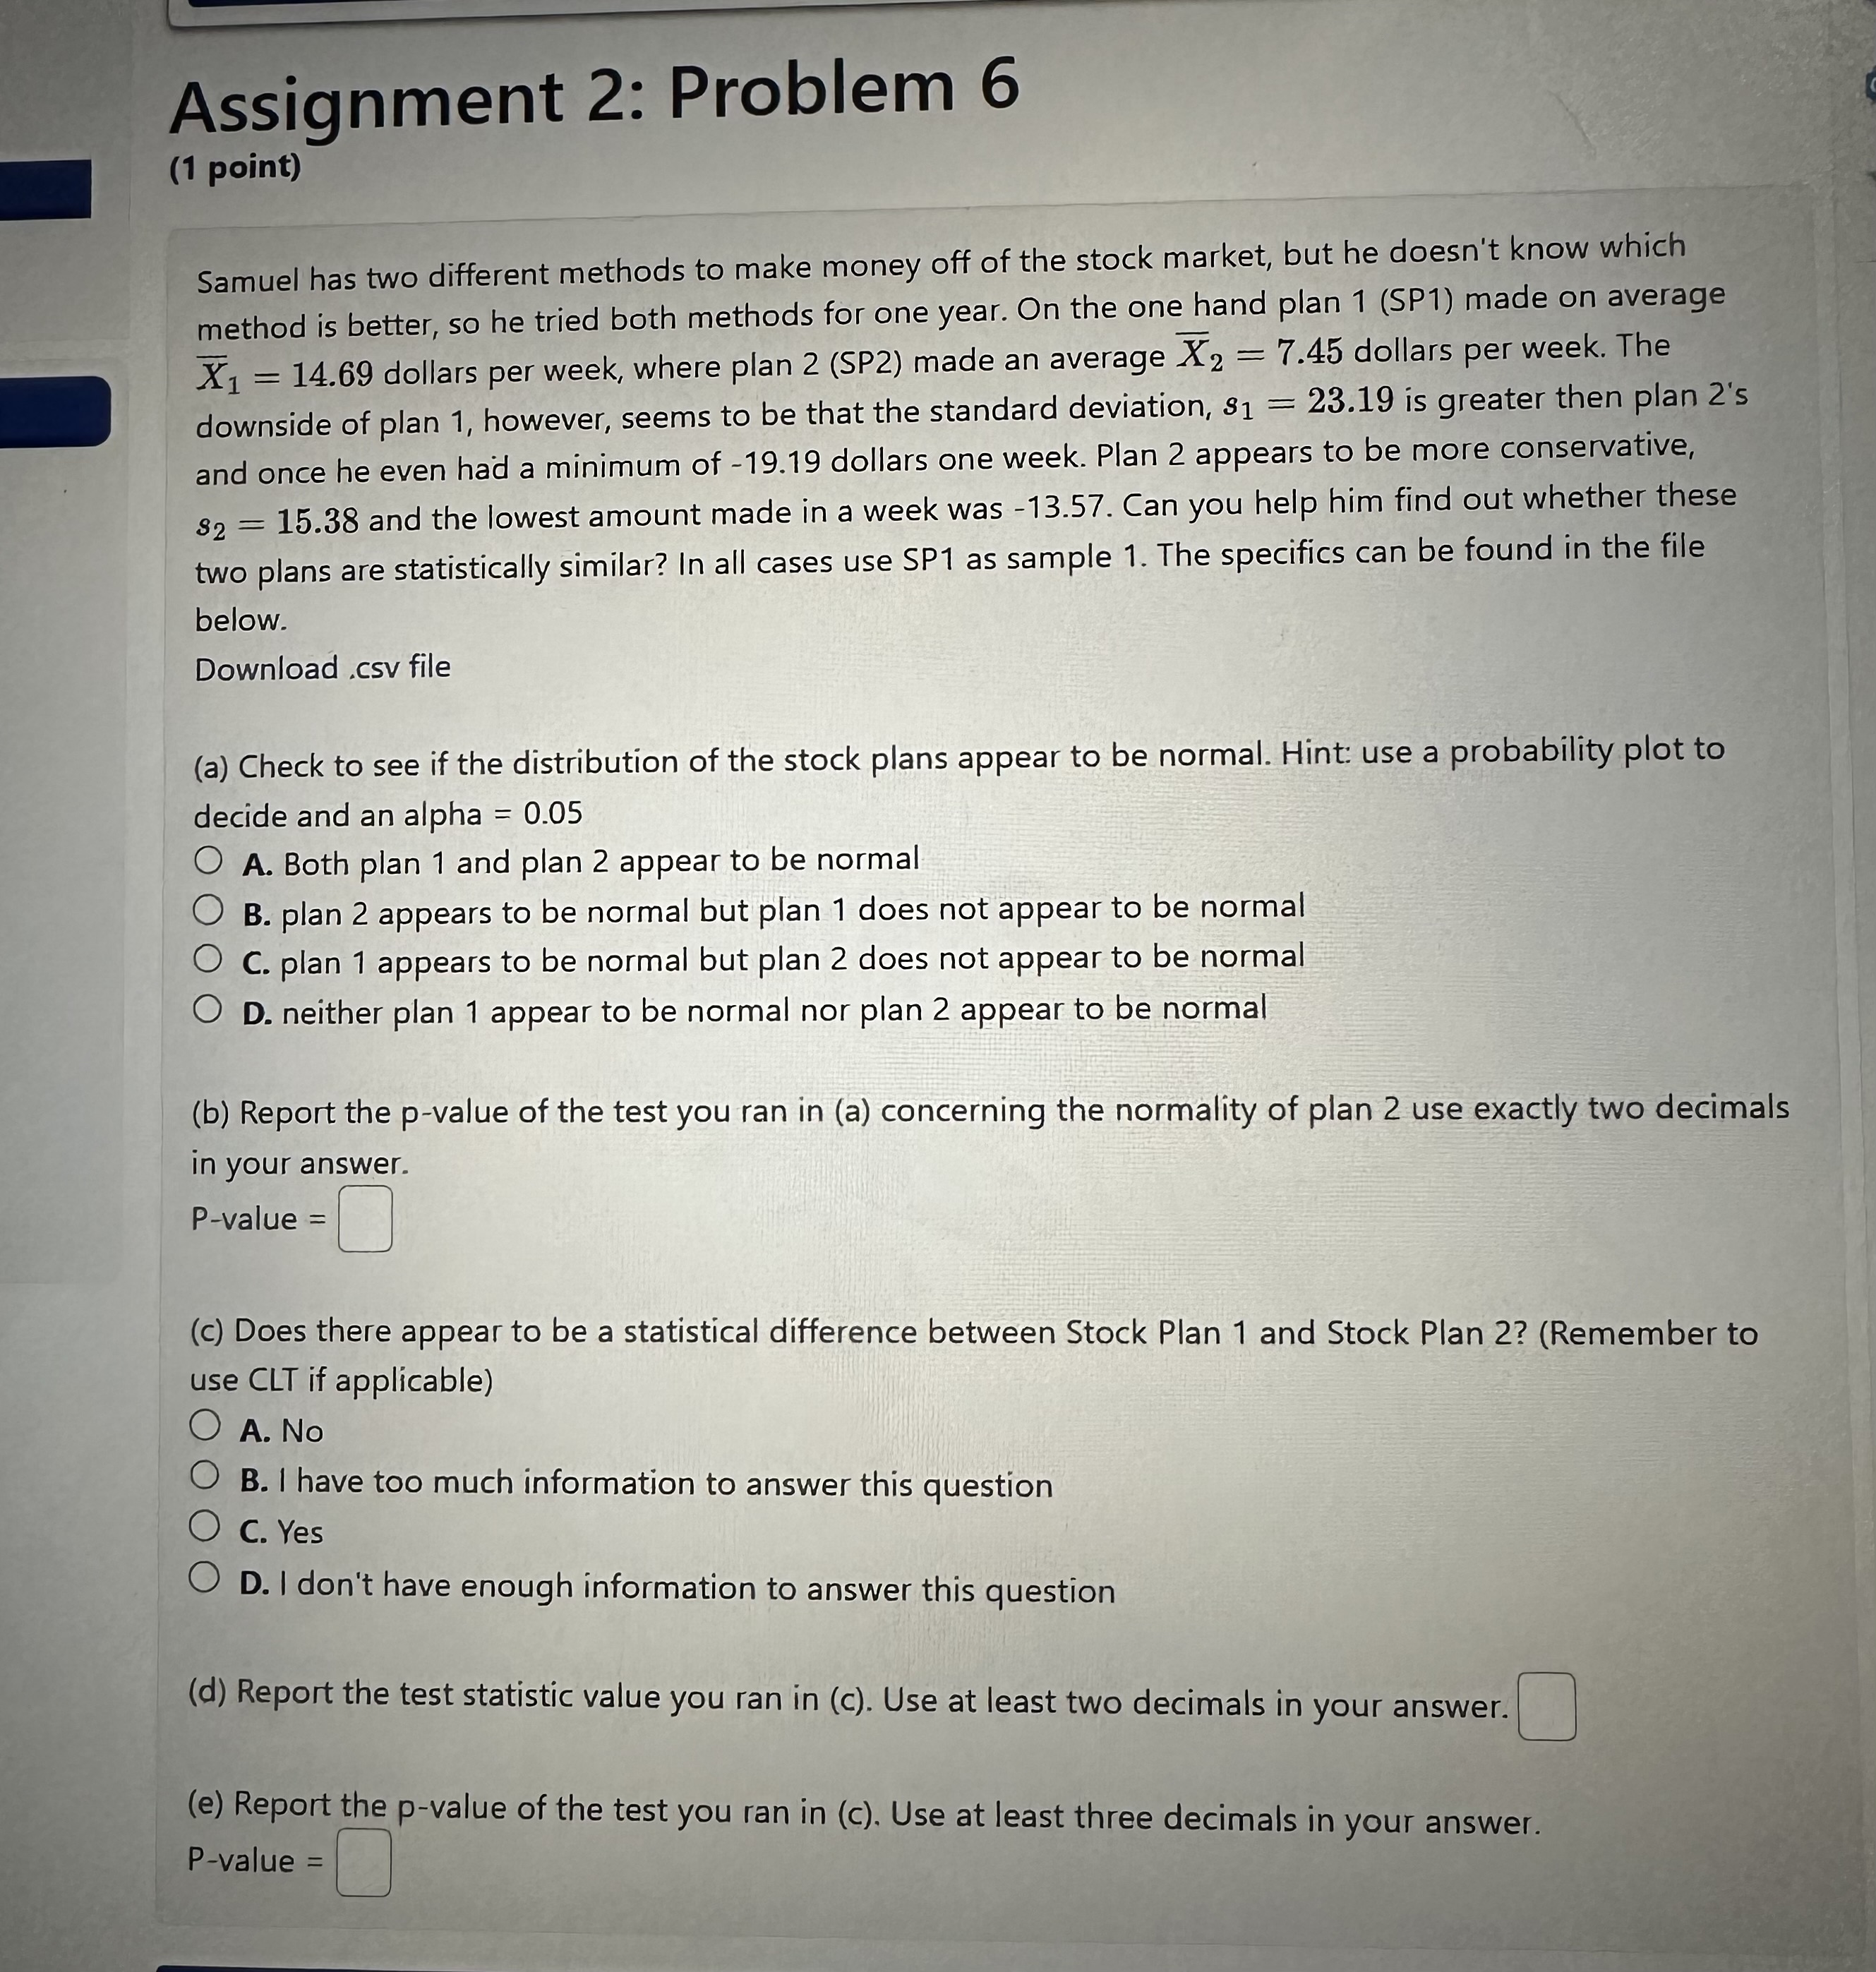
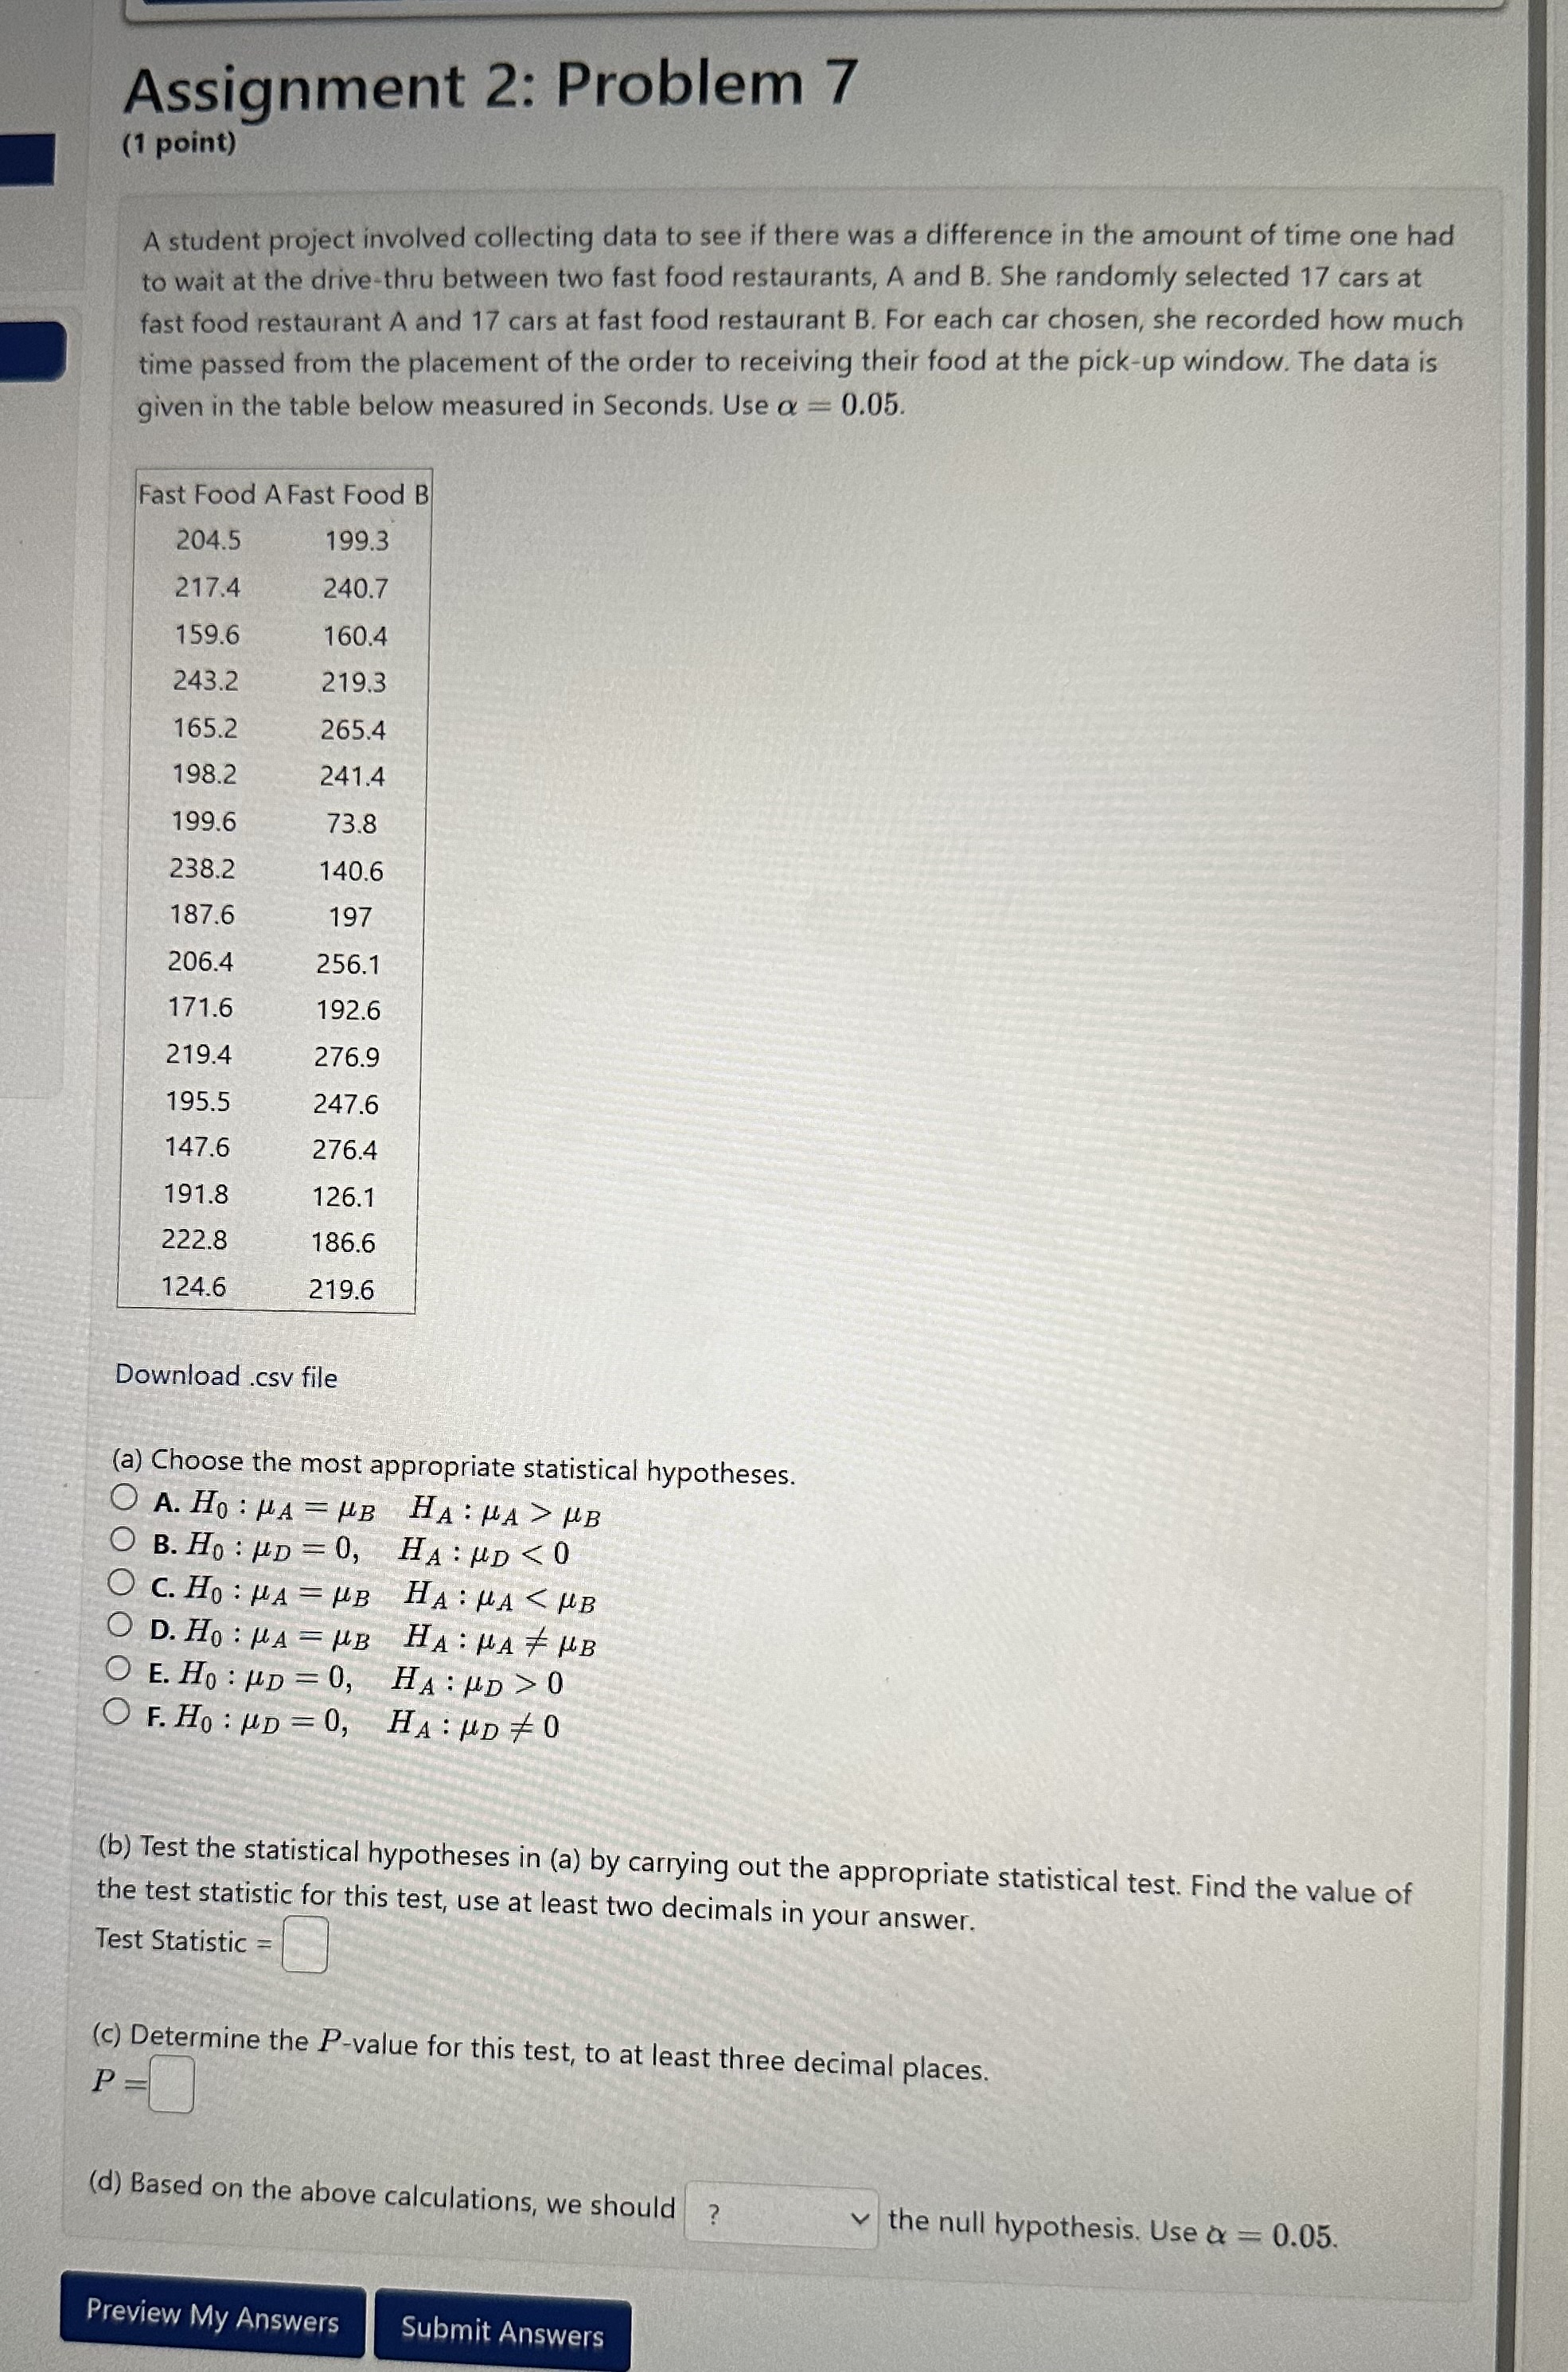
Assignment 2: Problem 6 (1 point) Samuel has two different methods to make money off of the stock market, but he doesn't know which method is better, so he tried both methods for one year. On the one hand plan 1 (SP1) made on average X1 = 14.69 dollars per week, where plan 2 (SP2) made an average X2 = 7.45 dollars per week. The downside of plan 1, however, seems to be that the standard deviation, $1 = 23.19 is greater then plan 2's and once he even had a minimum of -19.19 dollars one week. Plan 2 appears to be more conservative, $2 = 15.38 and the lowest amount made in a week was -13.57. Can you help him find out whether these two plans are statistically similar? In all cases use SP1 as sample 1. The specifics can be found in the file below. Download .csv file (a) Check to see if the distribution of the stock plans appear to be normal. Hint: use a probability plot to decide and an alpha = 0.05 A. Both plan 1 and plan 2 appear to be normal B. plan 2 appears to be normal but plan 1 does not appear to be normal C. plan 1 appears to be normal but plan 2 does not appear to be normal D. neither plan 1 appear to be normal nor plan 2 appear to be normal (b) Report the p-value of the test you ran in (a) concerning the normality of plan 2 use exactly two decimals in your answer. P-value = (c) Does there appear to be a statistical difference between Stock Plan 1 and Stock Plan 2? (Remember to use CLT if applicable) O A. No O B. I have too much information to answer this question O C. Yes O D. I don't have enough information to answer this question (d) Report the test statistic value you ran in (c). Use at least two decimals in your answer. (e) Report the p-value of the test you ran in (c). Use at least three decimals in your answer. P-value =Assignment 2: Problem 7 (1 point) A student project involved collecting data to see if there was a difference in the amount of time one had to wait at the drive-thru between two fast food restaurants, A and B. She randomly selected 17 cars at fast food restaurant A and 17 cars at fast food restaurant B. For each car chosen, she recorded how much time passed from the placement of the order to receiving their food at the pick-up window. The data is given in the table below measured in Seconds. Use a = 0.05. Fast Food A Fast Food B 204.5 199.3 217.4 240.7 159.6 160.4 243.2 219.3 165.2 265.4 198.2 241.4 199.6 73.8 238.2 140.6 187.6 197 206.4 256.1 171.6 192.6 219.4 276.9 195.5 247.6 147.6 276.4 191.8 126.1 222.8 186.6 124.6 219.6 Download .csv file (a) Choose the most appropriate statistical hypotheses. O A. HO : HA = HB HA : HA > UB O B. Ho : MD = 0, HA : MD 0 O F. Ho : MD = 0, HA : UD # 0 (b) Test the statistical hypotheses in (a) by carrying out the appropriate statistical test. Find the value of the test statistic for this test, use at least two decimals in your answer. Test Statistic = (c) Determine the P-value for this test, to at least three decimal places. P = (d) Based on the above calculations, we should the null hypothesis. Use a = 0.05. Preview My Answers Submit Answers
Step by Step Solution
There are 3 Steps involved in it

Get step-by-step solutions from verified subject matter experts